BASEN: Base-level genome-copy abundance estimation for long-read metagenomics
November 1, 2026
Contents |
Introduction
- Background
- Long-read metagenomic studies increasingly use custom reference databases comprising known genomes or metagenome-assembled genomes (MAGs). Kraken2 provides rapid taxonomic classification against such user-defined reference collections Wood et al. (2019).
- Common summaries of Kraken2 output, including species-level read proportions and Bracken estimates Lu et al. (2017), are based on read counts. Because the amount of sequence contributed by a taxon depends on its genome size, these estimates primarily reflect genomic-DNA composition and can over-represent taxa with larger genomes.
- Rationale
- For many microbiome applications, relative abundance is more appropriately interpreted as genome-copy composition. Genome-length normalization accounts for differences in genome size and provides an estimate that is more comparable across species.
- Kraken2 per-read output also retains the taxonomic assignments of individual k-mer positions. The proportion of unassigned k-mers and the diversity of assigned taxa can therefore be used to identify reads with weak or diffuse reference support, including reads originating from taxa absent from the reference database.
- Objective
- BASEN provides base-level genome-copy abundance estimation for long-read metagenomics from Kraken2 per-read classifications.
- BASEN combines species-assigned k-mer evidence with genome-length normalization and optional read-level filtering of weak or diffuse classifications.
- This report describes the BASEN workflow, diagnostic procedures, and performance using mock-community long-read datasets, with Kraken2 read proportions and Bracken included for comparison.
Demonstration data and methods
- Three ZymoBIOMICS mock communities were sequenced in six Oxford Nanopore runs each. The following names are used for the mock-community analyses.
- Four abundance methods were evaluated using the same Kraken2 classifications, allowing differences attributable to abundance estimation and read filtering to be assessed.
- Kraken2 (v2.1.3): species-level read proportion (species-rank clade reads / their sum)
- Bracken (v3.0.1;
-l S -t 10, read length = the sample's median read length) - BASEN-nf (v1.0.0): BASEN without read filtering, included to assess the contribution of the filter
- BASEN (v1.0.0): BASEN with read filtering at the default thresholds
- Methods (click each item to expand)
Depth-matched subsampling
- Rationale: The six Oral runs were generated from a single library on one flow cell and differed primarily in sequencing depth (30,780–165,929 Q ≥ 20 reads). To distinguish depth-related effects from run-to-run variation, each run was subsampled to a common depth below that of the shallowest run.
- Each Oral run was subsampled to 25,000 reads using seqtk v1.3 (
sample -s 42). - Bracken used the median read length of the corresponding full run; median read lengths in the subsampled datasets differed from the full runs' by at most 1.4%.
Kraken2 databases and reference composition
- Kraken2 Wood et al. (2019) v2.1.3 was run with a 35-bp k-mer length and 31-bp minimizer length.
- A separate database was constructed for each mock community using only its corresponding catalogue reference genomes, with no host or decoy sequences included.
- Oral: the 12 reference genomes specified by the manufacturer.
- Microbial: the ZymoBIOMICS reference genome collection (
ZymoBIOMICS.STD.refseq). - Gut: the 21 reference genomes specified by the manufacturer (17 species). The five E. coli strains share one species taxon, whose genome length is their mean (4.95 Mb), and their reference shares were summed.
- Five strains of the Microbial standard were replaced from lot ZRC190633; the manufacturer manual assigns reference release v3 to all current lots and an older genome set (ZymoBIOMICS.STD.genomes.ZR160406) to the two earlier lots (v1.3.0, Appendix C). Runs 4–6 used lot 252193. Runs 1–3 came from an earlier purchase (October 2020) whose lot was not recorded, so their reads were mapped (Minimap2 v2.30) to both sets: for each of the five replaced strains they aligned with higher identity to v3 (e.g., C. neoformans 0.988 vs 0.923, E. coli 0.995 vs 0.976), and 88% of their reads from these species mapped to v3 when both sets were offered, as did 92% for runs 4–6. All six runs therefore carry the current strains, and results use v3.
- Reference compositions were taken from the manufacturer's reported % genomic DNA, % 16S copies, % genome copies, and % cells. Each abundance method was compared against all available reference measures after renormalization over the catalogue species.
Reads from absent taxa (spike-in mixtures)
- Rationale: Real metagenomic samples contain reads from organisms whose genomes are absent from the reference database, including non-target taxa and organisms not recovered as MAGs. Pure mock communities classified against their own catalogue genomes do not contain such reads. To model this scenario, reads from a second mock community of known composition were added as reference-absent reads, allowing their classification, filtering, and impact on the abundance profile to be tracked directly.
- Two levels of difficulty were considered:
- Unrelated absent taxa: Microbial and Oral share no species and were therefore used as reciprocal sources of reference-absent reads. Added reads comprised 10%, 25%, or 50% of each mixture; 75% mixtures were used only for threshold analysis.
- Related absent taxa: Gut reads were added to Oral at 10%, 25%, or 50%. Gut contains congeners of several Oral taxa but no species sharing ≥95% ANI with the Oral reference genomes, based on skani v0.3.1 Shaw and Yu (2023) and the species-level threshold described by Jain et al. (2018). The highest relevant similarity was observed for Fusobacterium nucleatum at 91.0% ANI.
- Subsampling was performed using seqtk v1.3 with seed
-s 42. - All reads used in spike-in mixtures were host-free, trimmed to a maximum of 5,800 bp, and filtered to Q ≥ 20.
Read-filter threshold analysis
- Rationale: the read filter has two thresholds, a maximum unassigned-k-mer fraction and a maximum Shannon diversity, with defaults of 0.5 and 1.0 in
filter_low_info_reads(). To evaluate these defaults, all parameter combinations were assessed using spike-in mixtures with known read origins. - BASEN was recomputed across an 11 × 11 parameter grid: both thresholds were varied from 0 to 1 in increments of 0.1 (121 settings).
- Each setting was scored with Youden's J Youden (1950):
J = (absent-taxon reads removed / absent-taxon reads) − (catalogue reads removed / catalogue reads)
calculated among reads classified by Kraken2. - The defaults were compared with all 121 settings on the related mixtures (Gut reads in Oral; the more challenging classification scenario) and checked on the eight unrelated mixtures (10, 25, 50 and 75% added, in both directions).
- Application to other datasets: these defaults are supported by the absent taxa evaluated here. For each new study, the distributions of unassigned-k-mer fraction and Shannon diversity should be examined using
plot_kmer_qc()to select thresholds appropriate for the data.
- Rationale: the read filter has two thresholds, a maximum unassigned-k-mer fraction and a maximum Shannon diversity, with defaults of 0.5 and 1.0 in
Evaluation metrics
- Accuracy: L1 distance between the estimated and reference compositions across catalogue species; lower values indicate greater agreement:
L1 = Σ |estimated share − reference share| over the catalogue species
with both compositions as fractions summing to 1. It ranges from 0 (identical) to 2 (no species in common); half this distance represents the minimum fraction of total abundance that must be redistributed to match the reference (e.g., L1 0.325 = 16% of the abundance misallocated). - Samples: each run, and for each standard the six runs pooled (reads concatenated; Bracken read length = the pooled reads' median). The 25,000-read subsample was made for Oral only.
- Stability: SD of L1 distance and per-species coefficient of variation across the six Oral runs.
- Effect of absent taxa: profile shift, defined as the L1 distance between a method's profile with added reads and its corresponding profile without added reads.
- Read fate: proportion of added reads classified by Kraken2 and retained by the BASEN read-level filter.
- Random seeds: seqtk subsampling used
-s 42. Dorado, Kraken2, Bracken, Minimap2, and BASEN do not expose a random-seed parameter for the operations used here.
- Accuracy: L1 distance between the estimated and reference compositions across catalogue species; lower values indicate greater agreement:
| Name | Product | Composition | Genome sizes | Flow cell, kit and runs | Q ≥ 20 reads per run | Evaluation purpose |
|---|---|---|---|---|---|---|
| Microbial (D6300) | Microbial Community Standard | 10 species: 8 bacteria (12% gDNA each) and 2 yeasts (2% each) | 2.2–26.3 Mb (12-fold) | Flongle (FLO-FLG114), SQK-RBK114-24; six runs, one flow cell each | 105–11,351 (14,978 pooled) | Genome-copy abundance; unrelated absent taxa for Oral |
| Gut (D6331) | Gut Microbiome Standard | 17 species (21 strains): 14 bacteria, 2 yeasts and 1 archaeon | 1.9–12.8 Mb (7-fold) | Flongle (FLO-FLG114), SQK-RBK114-24; six runs, one flow cell each | 365–7,688 (13,367 pooled) | Genome-copy abundance; related absent taxa for Oral (shares Veillonella, Prevotella and Fusobacterium) |
| Oral (D6332) | Oral Microbiome Standard | 12 species: 12 bacteria | 1.9–2.7 Mb (1.4-fold) | MinION (FLO-MIN114), SQK-RBK114-96; six runs on one flow cell, differing only in depth after flow-cell washes | 30,780–165,929 | Accuracy and run-to-run stability; unrelated absent taxa for Microbial |
Read preprocessing and quality control
- Basecalling
- All POD5 files from the 18 runs, including files in
pod5_skip/, were re-basecalled with Dorado (v2.1.2;sup@v5.2.0) and demultiplexed to retain the sample barcode for each run. - Quality assessment
- Dorado Run Analyzer: sequencing-run assessment across all 18 runs, including MinKNOW reports, read length, read quality and pore activity.
- Detailed MultiQC results: NanoPlot De Coster et al. (2018), FastQC and MultiQC Ewels et al. (2016) per run, per barcode and in four read-length windows (1–999, 1,000–9,999, 10,000–99,999 and ≥ 100,000 bp).
- Read quality control
- A uniform read-length rule was applied across datasets: reads ≥ 100,000 bp were removed (mean Q 2.8–3.2), and remaining reads longer than 5,800 bp were trimmed to 5,800 bp. This threshold was selected from the decline in per-base quality observed in Microbial-05 (D6300 run 5, barcode05; mean per-base Q 34.7 at 5,800 bp, 24.1 at 6,000 bp) in the length-window QC.
- Human reads were removed using Minimap2 Li (2018) (v2.30) against GRCh38; reads with Dorado mean Q < 20 were subsequently excluded.
- Reads entering Kraken2 (Q ≥ 20) per run: Microbial 105–11,351, Gut 365–7,688, Oral 30,780–165,929; the median read length of each run was used as its Bracken read-length parameter.
Results
- BASEN improves agreement with genome-copy composition as genome-size variation increases
- Input: each standard's six runs pooled (Microbial 14,978 reads, Gut 13,367, Oral 504,834), each classified against a database of its own catalogue genomes (Microbial: reference set v3).
- Three manufacturer-reported reference compositions were considered (Table 1 of the product documentation). The definitions below use the Microbial standard, prepared by pooling pure cultures at a predetermined composition, as an example:
- % genomic DNA: the share of the total DNA mass from each species, as designed (12% for each bacterium, 2% for each yeast). Read and base counts primarily reflect this DNA contribution.
- % genome copies: the share of genomes. The manufacturer computes it as
DNA mass / genome size: a large genome carries more DNA per copy, so the same DNA mass holds fewer copies. BASEN estimates this genome-copy composition (assigned bases / genome length). The yeast genomes are 3–12 times larger than the bacterial ones, so the yeasts are 2% of the DNA but only 0.57% (S. cerevisiae) and 0.37% (C. neoformans) of genome copies; the corresponding values for the two Gut yeasts are 1.5% and 1.4% of the DNA; 0.31% and 0.32% of genome copies. - % cells:
genome copies / ploidy(copies per cell). For the bacteria, this is nearly equivalent to % genome copies (one genome per cell); the two yeasts carry two copies per cell, so their cell share is half their genome-copy share (S. cerevisiae: 0.29% of cells). - L1 distance to the manufacturer's composition (lower values indicate greater agreement), each standard against its own catalogue database. Six runs pooled. Bold: lowest value in each column (ties at three decimals both bold).
- Microbial (genome sizes 12-fold): BASEN-nf and BASEN were closest to the genome-copy composition (L1 0.336 and 0.337 to % genome copies; 0.372 and 0.369 to % gDNA). Kraken2 and Bracken showed the opposite pattern, tracking the DNA composition (L1 to % gDNA 0.173 and 0.174; to % genome copies 0.376). The largest differences were observed for the yeasts: read-count estimates were 3.1–6.3× and BASEN estimates were 0.35–0.72× (
estimate / expected % genome copies). The read filter changed BASEN's L1 by at most 0.003. - Gut (7-fold): a similar pattern was observed. BASEN was closer to genome copies (L1 0.656–0.660 vs 0.730–0.731 for Kraken2 and Bracken), whereas Kraken2 and Bracken were closer to the DNA composition (0.609 vs 0.686–0.691). For the yeasts, read-count estimates were 2.3–2.7×, BASEN 0.40–0.60×. L1 distances were high for all methods because of shared deviations (e.g., E. coli at 30–33% of each profile against 8.7% of genome copies), consistent with effects preceding abundance estimation.
- Oral (1.4-fold): DNA and genome-copy compositions nearly coincide, and the four methods were within 0.031 of each other (pooled L1 to % gDNA 0.292–0.323).
- BASEN achieves comparable accuracy and lower variation in error across high-depth runs
- Input: the six Oral runs (30,780–165,929 reads), at full depth and subsampled to 25,000 reads. Oral is the only standard whose runs are technical replicates (one library on one flow cell, differing only in depth) and sufficiently deep for subsampling to a common read count; Microbial and Gut runs are separate flow cells with 105–11,351 and 365–7,688 reads, so variation between these runs reflects differences in depth, flow cell and handling.
- Genome sizes span only 1.4-fold, so DNA and genome-copy compositions nearly coincide. BASEN was as accurate as the read-based summaries (L1 to % gDNA 0.320–0.324 for all four; 0.319–0.327 at 25,000 reads).
- Choice of reference composition: in Oral the genome sizes span only 1.4-fold, so the two compositions nearly coincide, and gDNA provides a comparable reference for all four methods.
- In panel A, the y-axis shows L1 distance to the manufacturer's % gDNA; half this distance represents the minimum abundance redistribution required to match the reference (0.32 ≈ 16%; 0.29 ≈ 14.5%, 0.37 ≈ 18.5%). Each point represents one run and method, with all 25,000-read subsamples positioned at 25k. A narrower vertical distribution indicates lower variation in error across runs. In panel B, each point represents one species, and lower CV values indicate lower relative variation across runs.
- Panel A indicates that the minimum abundance redistribution required to match the reference was about 16% for all methods. This fraction ranged from about 14.5% to 18.5% across runs for read-count methods, compared with about 16% to 17% for BASEN.
- Panel B shows relative variation of 8–9% in species-level abundance across methods (median CV 0.08 for BASEN, 0.09 for read counts). The wider BASEN distribution reflects lower variation for the four most abundant species (CV 0.01–0.03 against 0.03–0.10) but slightly higher variation for the four species with low reference abundance.
- Across the six runs, the SD of BASEN's L1 error was fourfold lower than that of the read-based methods (SD 0.006–0.007 vs 0.028), with a similar reduction after subsampling each run to 25,000 reads (0.006 vs 0.029). Per species the variation was similar (median CV 0.08 vs 0.09). No consistent dependence of accuracy on depth was observed over the sequenced range.
- BASEN limits profile shifts caused by reads from taxa absent from the database
- Input: a standard's reads mixed with reads from another standard whose species are not in the database, at 10, 25 and 50% of the mix, in three combinations (one per panel):
- Microbial sample, Oral reads added (unrelated): the two standards share no species.
- Oral sample, Microbial reads added (unrelated): the reciprocal mixture of the same two standards.
- Oral sample, Gut reads added (related): Gut shares genera with Oral (Veillonella, Prevotella, Fusobacterium) but no species at ≥ 95% ANI.
- K-mer weighting and read filtering. For every read, Kraken2 reports the taxon each of its 35-bp k-mers matches (or none). BASEN uses these per-read assignments for two purposes:
- Abundance: a species is credited only with the k-mers that match exactly the taxon its read was assigned to, divided by its genome length:
abundance of a species ∝ Σ k-mers matching it / (genome length − 35 + 1)
Reads classified on the basis of few matching k-mers therefore contribute little to the abundance estimate. - Read filter (BASEN; omitted in BASEN-nf): a classified read is retained only if (i) at most half of its k-mers are unassigned and (ii) the taxonomic diversity of its k-mers does not exceed the Shannon threshold:
unassigned k-mers / (read length − 35 + 1) ≤ 0.5Shannon diversity = −Σ p_t × ln(p_t) ≤ 1.0
where p_t is the share of the read's k-mers on taxon t and unmatched k-mers count as one group (0 = all on one taxon; about 1.1 = split evenly over three). Reads from genomes absent from the database can fail either criterion because most k-mers are unassigned or the matching k-mers are distributed across taxa. - In (A) each line is one method, and the y-axis is the profile shift:
profile shift = Σ |share with added reads − share without| over the catalogue species
Half this distance represents the minimum fraction of abundance redistributed between profiles (0.17 ≈ 8.5%). A flat line indicates that added reads do not alter the estimated profile. - Added reads shifted the read-based profiles in proportion to how many were added: at 50% unrelated reads by 0.01 (Microbial sample) and 0.04 (Oral sample), and at 50% related reads by 0.17.
- BASEN-nf profiles shifted by at most 0.002 and 0.022, because misclassified reads carry few k-mers of the species they are assigned to (median 0.3–6.9% of their k-mers, against 87–93% for the sample's own reads). With the read filter (BASEN), the shift fell to 0 for unrelated reads and 0.003 for related reads.
- Panel B summarizes classification and retention of the added reads. Grey: added reads that Kraken2 assigned to a catalogue species; Kraken2, Bracken and BASEN-nf all use these classified reads (Bracken redistributes reads and excludes species with fewer than 10; BASEN-nf weights them by k-mers but removes none). Blue: the subset retained by the read filter and used by BASEN.
- Kraken2 classified 3.4% of reads from an unrelated standard (977 of 28,846 over the 10–50% mixtures) and 15% of reads from related taxa (750 of 4,992 at 50%), mostly to the Oral species Veillonella parvula (441) and Fusobacterium nucleatum (209).
- The read filter retained none of the 977 unrelated-taxon reads Kraken2 had classified and 18 of the 750 related-taxon reads at 50%.
- The filter removed 1.8–3.3% of classified catalogue reads (Microbial: 13,754 of 14,228 classified reads retained; Oral: 4,785 of 4,873).
- Threshold analysis supports the default read-filter parameters
- The analyses in sections 1–3 used the default read-filter thresholds: a read is retained if at most 0.5 of its k-mers are unassigned and the Shannon diversity of its k-mers' taxa is at most 1.0. The following analysis evaluates support for these defaults.
- Input: the spike-in mixtures of section 3, for which the origin of every read is known. Both thresholds were varied from 0 to 1 in steps of 0.1 (121 settings), and each setting was scored with Youden's J (J):
J = (absent-taxon reads removed / absent-taxon reads) − (catalogue reads removed / catalogue reads)
(1 = all absent-taxon reads removed and no catalogue read lost). Related mixtures (Gut reads in Oral) provide the more challenging classification scenario; unrelated mixtures provide an additional comparison. - In (A) each tile is one setting with darker shading indicating higher J; the left map uses the related mixtures, the right the unrelated mixtures, and (0.5, 1.0) is outlined.
- (0.5, 1.0) had the highest J of the 121 settings on the related mixtures (0.959).
- Unassigned-k-mer threshold: with Shannon diversity at 1.0, a lower threshold increased catalogue-read loss relative to removal of related-taxon reads (0.4: J 0.957; 0.3: 0.944), and a higher threshold retained more related-taxon reads (0.6: J 0.949; 0.7: 0.909).
- Shannon diversity threshold: with the unassigned fraction at 0.5, J rose with the Shannon limit (0.8: 0.951; 0.9: 0.957; 1.0: 0.959). 1.0 is the upper end of the grid; higher limits were not tested.
- On the unrelated mixtures, for which a broad range of intermediate settings removed absent-taxon reads, (0.5, 1.0) was within 0.005 of the best J.
- In (B) each line is one setting, followed as Gut reads are added to the Oral sample (y-axis: profile shift, as in section 3; the two halves have different scales). Left: unassigned k-mer fraction fixed at 0.5, one line per Shannon diversity limit (dashed, triangles). Right: Shannon diversity fixed at 1.0, one line per unassigned k-mer fraction. Darker = stricter; (0.5, 1.0) in blue.
- The unassigned-k-mer threshold accounts for most of the filtering effect: at 50% added reads, profile shift increased from 0.0001 at 0.3 to 0.0025 at 0.5 and 0.022 at 1.0 (no limit). Consistent with this effect, Kraken2 left most k-mers of a classified absent-taxon read unassigned (median 93–99% across the three 50% mixtures, against 7–12% for the sample's own reads), so 97–99% of them exceed the 0.5 limit, against 1.5–2.1% of the sample's own reads.
- The Shannon threshold affected profile shifts primarily at lower values: at 0.6 or below the shift was near 0, while 0.8, 0.9 and 1.0 gave the same shift (0.0025), resulting in overlapping curves.
- Lower thresholds reduce profile shifts but remove more catalogue reads (panel A), consistent with the maximum J at (0.5, 1.0) rather than at the lowest thresholds.
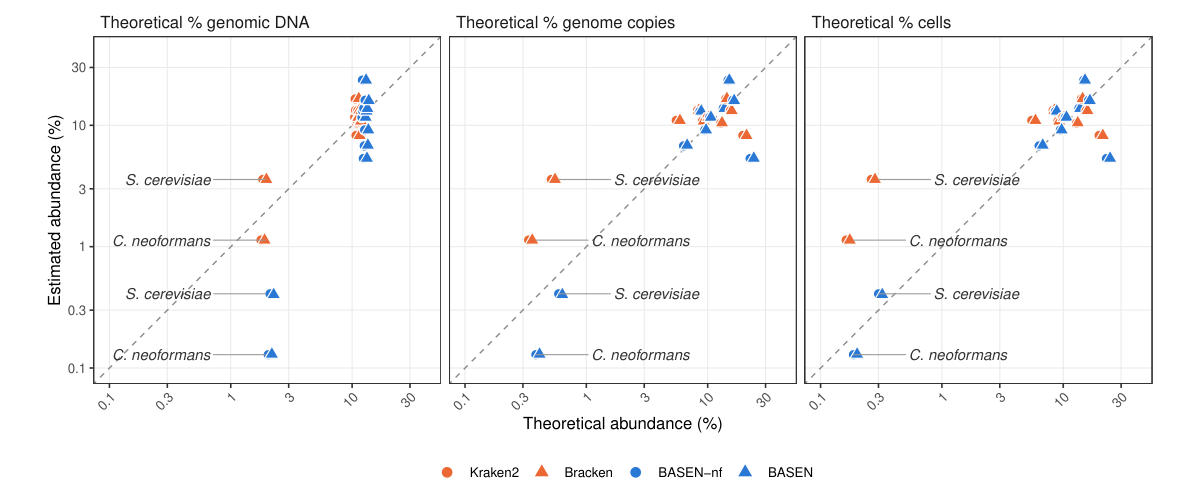
Microbial standard (D6300), six runs pooled, reference set v3. Estimated against theoretical abundance (log–log; dashed line y = x) against % genomic DNA, % genome copies and % cells. Named species: the two whose genome-copy share differs most from their DNA share.
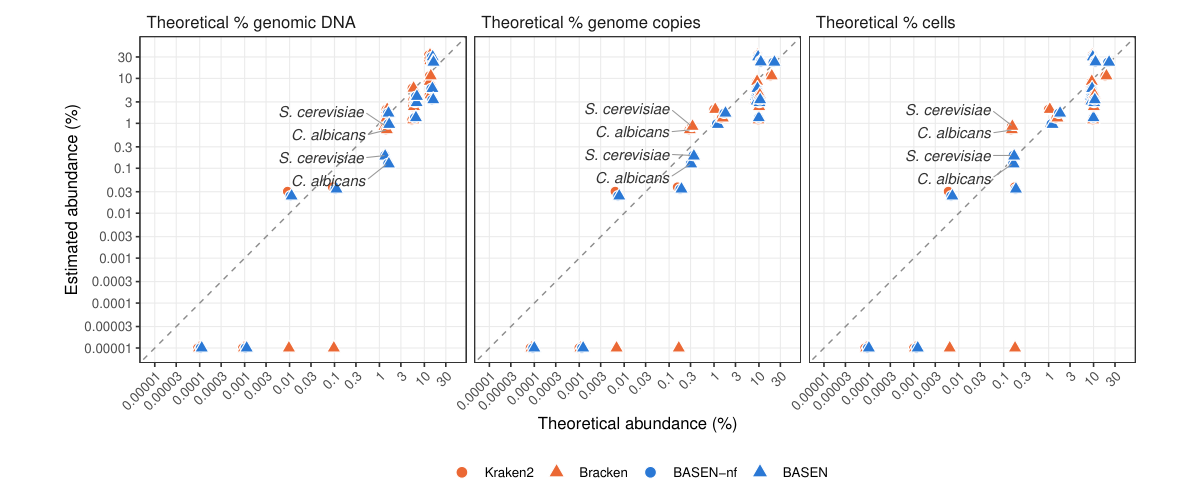
Gut standard (D6331), six runs pooled. Estimated against theoretical abundance (log–log; dashed line y = x) against % genomic DNA, % genome copies and % cells. Points on the bottom edge: species estimated at 0% (no reads assigned, or below Bracken's 10-read cut-off). Named species: the two whose genome-copy share differs most from their DNA share.
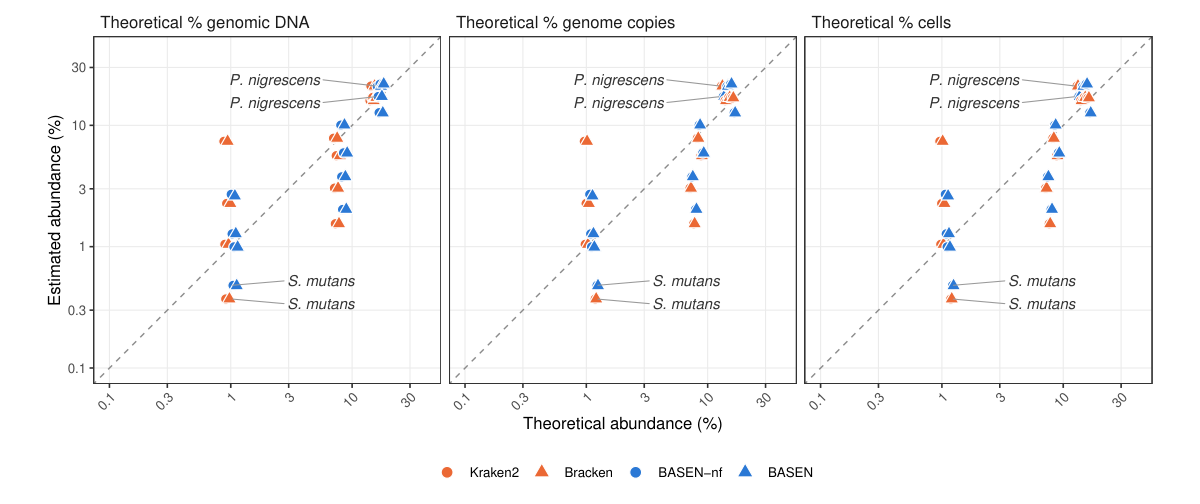
Oral standard (D6332), six runs pooled. Estimated against theoretical abundance (log–log; dashed line y = x) against % genomic DNA, % genome copies and % cells. Named species: the two whose genome-copy share differs most from their DNA share.
| Method | Microbial | Gut | Oral | |||
|---|---|---|---|---|---|---|
| % gDNA | % genome copies | % gDNA | % genome copies | % gDNA | % genome copies | |
| Kraken2 | 0.173 | 0.376 | 0.609 | 0.730 | 0.292 | 0.320 |
| Bracken | 0.174 | 0.376 | 0.609 | 0.731 | 0.292 | 0.319 |
| BASEN-nf | 0.372 | 0.336 | 0.686 | 0.656 | 0.322 | 0.348 |
| BASEN | 0.369 | 0.337 | 0.691 | 0.660 | 0.323 | 0.349 |
Takeaway: Genome-length normalization reduces genome-size-associated abundance bias, with a larger effect in communities spanning a wider range of genome sizes.
Run-level L1 distances for all reference compositions, species-level estimates, genome-length associations and yeast fold errors are provided in Genome-size details.
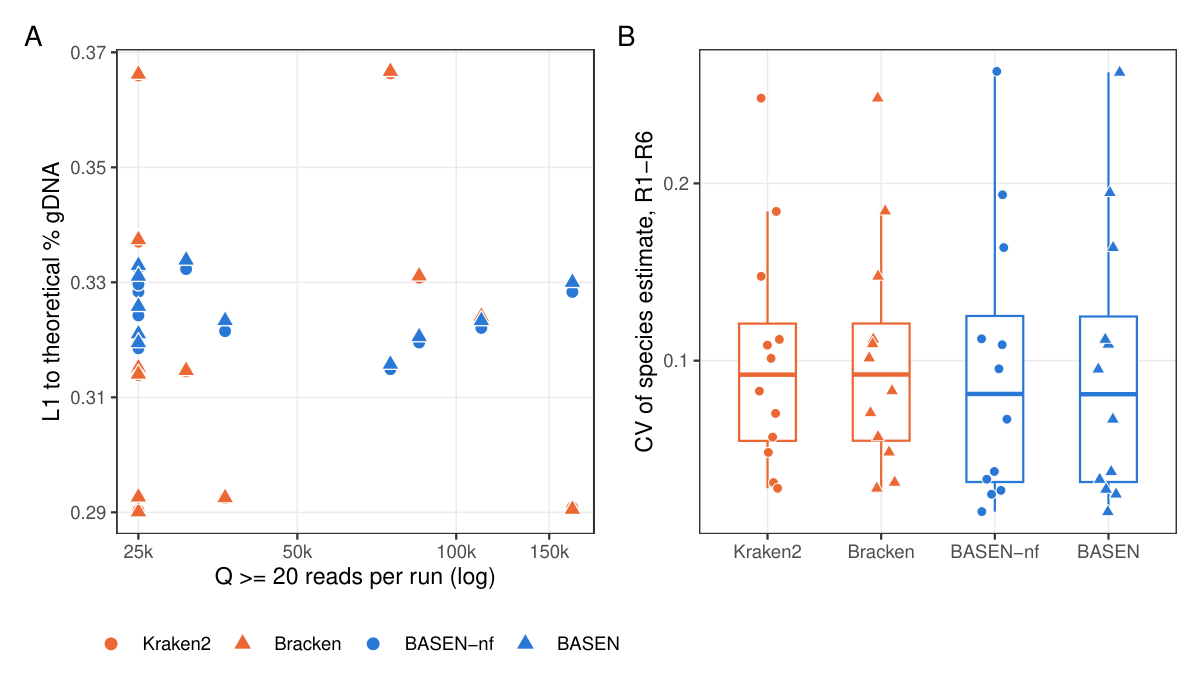
Oral standard (D6332; runs R1–R6 = Oral-01 to -06). (A) L1 to % gDNA against depth, per run and method, full depth and 25,000 reads. (B) Per-species coefficient of variation across the six runs.
Takeaway: At depths of tens of thousands of reads per run, BASEN achieves accuracy comparable to read-count methods when genome sizes are similar, with a fourfold lower SD of error across runs. This stability advantage was not observed in runs containing hundreds to a few thousand reads.
Oral run-level L1 distances at full depth and at 25,000 reads, species-level variation and between-run variation across all three standards are provided in Accuracy and stability details.
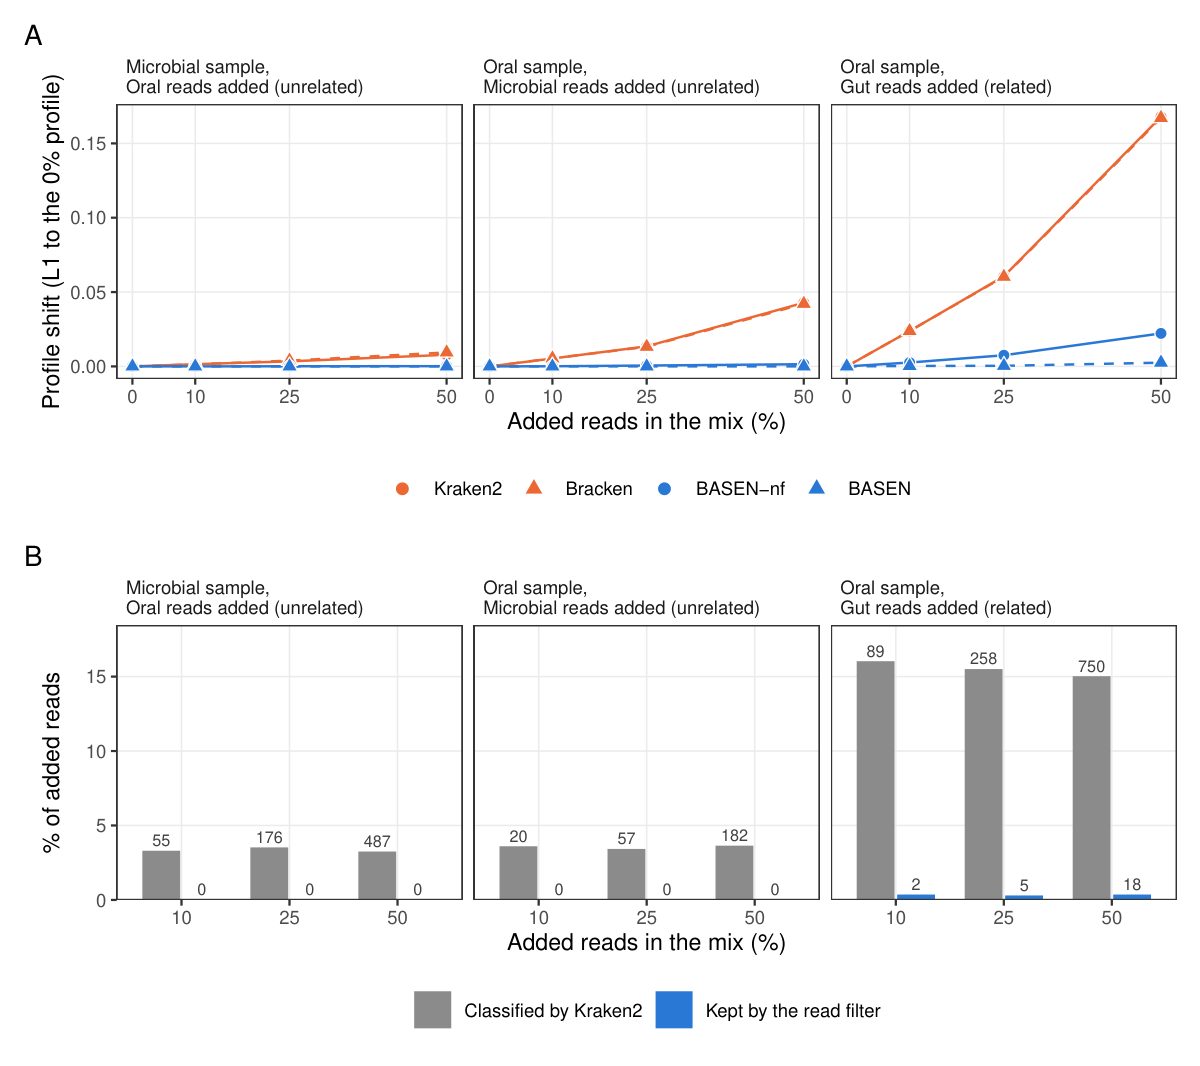
Reads from taxa absent from the database, added at 10–50% of the mix. (A) Profile shift per method as the share of added reads grows. (B) Added reads classified by Kraken2 and retained by the read filter; numbers are reads.
Takeaway: Reads from absent taxa produce progressively larger shifts in read-count profiles as their proportion increases. BASEN's k-mer weighting reduces these shifts, and read filtering removes nearly all of the remaining effect while excluding 2–3% of classified catalogue reads.
Profile shifts for all mixtures and methods, classification and retention of added reads, assigned taxa and k-mer support are provided in Absent-taxa details.
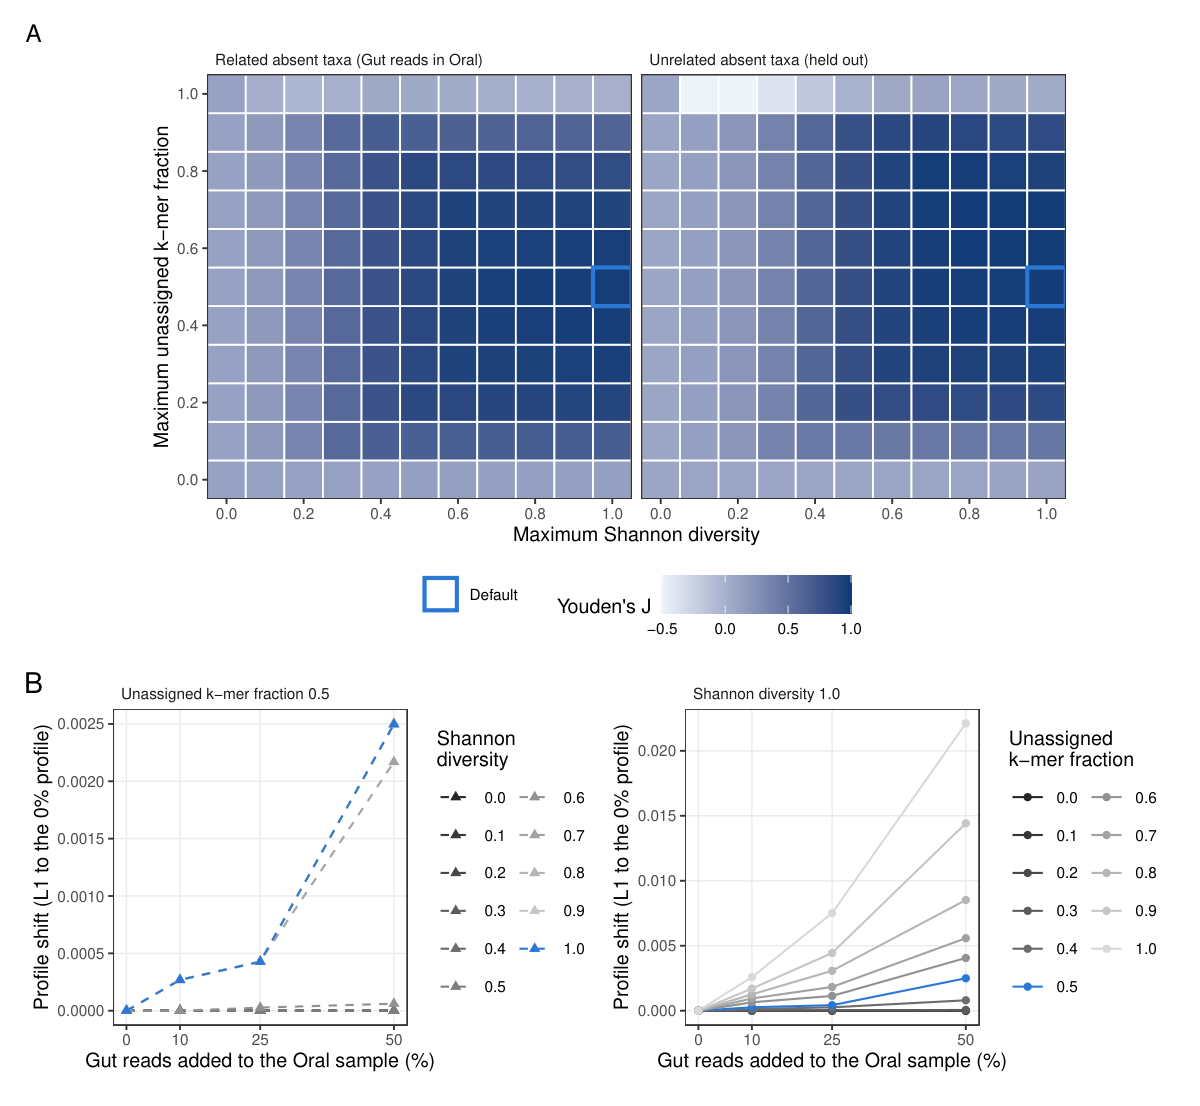
Read-filter thresholds over the 121-setting grid. (A) J over the grid. (B) Profile shift of the Oral sample as Gut reads are added (as in section 3), along each threshold with the other fixed at its default.
Takeaway: The unassigned-k-mer fraction is the principal contributor to filtering in these mixtures. A threshold of 0.5 excludes nearly all classified absent-taxon reads, while the complete filter removes 2–3% of classified catalogue reads. Shannon thresholds above 0.8 have little additional effect on profile shift. These results support 0.5 and 1.0 as the defaults of
Before applying these defaults to a new study, examine the distributions of unassigned-k-mer fraction and Shannon diversity (filter_low_info_reads() used for the mock-community analyses.plot_kmer_qc()) and select values appropriate for your data; filter_low_info_reads() accepts user-defined thresholds.
Discussion
- BASEN estimates genome-copy composition. Given reads classified against a defined reference collection, BASEN estimates the relative genome-copy abundance of each represented species. Read-based summaries estimate the DNA composition instead, and the difference between these abundance measures increases with genome-size variation: minimal in Oral (1.4-fold), but more pronounced in Gut (7-fold) and Microbial (12-fold), where read counts overestimated the yeasts two- to six-fold. Across species, Kraken2's overestimation increased with genome length (Spearman rho 0.93 in Microbial, 0.79 in Gut), and BASEN substantially reduced this association (−0.04 and 0.18).
- Stability depends on sequencing depth. Across the six deep Oral runs (30,780–165,929 reads) the SD of BASEN's error was fourfold lower than that of read-count methods, including after subsampling to 25,000 reads. In the small Microbial and Gut runs (hundreds to a few thousand reads) no stability advantage was observed. The improvement in consistency should therefore be interpreted within the evaluated depth range.
- Bracken closely approximates species-level read proportions in these databases. Bracken reassigns reads classified above species level; in databases of the catalogue genomes alone there are few such reads, so on the pooled samples it was within 0.001 of the read share in L1. It differed only in small runs, where its 10-read cut-off removed species (e.g., Microbial run L1 to % gDNA 0.457 ± 0.333 vs 0.337 ± 0.164).
- Read filtering reduces the contribution of absent taxa. On pure mock communities, where every read belongs to a catalogue species, it changed pooled L1 by at most 0.004; its effect became evident when reads from absent taxa were introduced. Reads from closely related absent taxa present a greater classification challenge, since Kraken2 assigned 15% of them to a catalogue species; the filter removed 98% of those. This effect is primarily attributable to the unassigned-k-mer fraction: a read from an absent taxon can receive a species label from a few k-mers while most of its k-mers remain unassigned (median 93–99%, against 7–12% for catalogue reads), so the 0.5 limit removes nearly all such reads; the Shannon limit adds little.
- Scope. BASEN is designed as the second step of a targeted metagenomic analysis, where the taxa of interest and their reference genomes are already defined. References may include NCBI genomes or metagenome-assembled genomes (MAGs), allowing genome length to be specified for each species. Pre-built Kraken2 databases intended for broad taxonomic discovery are outside the intended scope. Pre-built discovery databases place taxa at many ranks, and a species' reads are spread over strains and assemblies with different lengths, making a single genome length per TaxID an approximation of uncertain validity.
- Limitations.
- Manufacturer-reported reference compositions describe the supplied cells or DNA and do not account for changes during extraction and sequencing. No method achieved L1 = 0, and deviations were shared across methods, including E. coli at 30–33% of each Gut profile against 8.7% of genome copies.
- The Microbial and Gut Flongle runs contained relatively few reads (105–11,351 and 365–7,688, respectively), limiting the precision of run-level estimates. The pooled Microbial analysis was dominated by run 6 (76% of reads), whereas Gut showed a consistent direction of effect across runs.
- BASEN estimates abundance at species level with one genome length per species; strains are not resolved (the five Gut E. coli strains share one taxon, with their mean genome length).
- The comparison was restricted to Kraken2 and Bracken. In our earlier comparison of long-read classifiers, Minimap2 discards high-frequency k-mers as alignment anchors, so in repetitive regions alignments are missed or placed on the wrong genome (checked with BLAST); Sylph reports genome-level coverage without per-read classification, which BASEN's per-read k-mer evidence and read filter require. Kraken2 supports fully custom databases and reports k-mer assignments for every read, so BASEN builds on its output.
- Practical notes.
- BASEN depends on accurate genome-length specification. Genome lengths should correspond to the assemblies used to construct the database; an inflated assembly length lowers the abundance estimate. Both v3 yeast assemblies are larger than their NCBI records (S. cerevisiae 18.8 vs 12.1 Mb; C. neoformans 26.3 vs 18.9 Mb), which may partly explain why BASEN underestimated the genome-copy shares of both yeasts (0.40% vs 0.57%; 0.13% vs 0.37%). Analysis of the same reads against Zymo's earlier release v2, whose S. cerevisiae assembly is 12.8 Mb, yielded 0.55%. Assembly length alone does not explain the observed differences: the Gut yeasts, whose assemblies are not inflated (S. cerevisiae 12.8 Mb, as in v2), were also below their genome-copy share (0.40× and 0.58×). This is consistent with incomplete lysis: the Microbial manual describes both yeasts as difficult to lyse. Incomplete lysis would reduce abundance estimates across methods, although genome-size-associated overestimation can mask this effect in read-count profiles.
- The read-filter defaults (unassigned k-mer fraction 0.5, Shannon diversity 1.0) are supported by the absent taxa evaluated here; Shannon limits above 1.0 were not tested. For each new study, examine the distributions of both measures (
plot_kmer_qc()) before choosing thresholds. - BASEN does not incorporate base quality; read-quality filtering should therefore precede abundance estimation (here Q ≥ 20).
AppendixHuman stool validation
- We evaluated BASEN in stool samples from critically ill patients collected on Day 1 of the ON-Time study (N = 19), using a database of 66 metagenome-assembled genomes (MAGs) reconstructed from the same patients' Illumina reads. In the absence of a known community composition, comparisons were performed between methods within each sample and restricted to the taxa represented by these MAGs.
- BASEN profiles more closely match Illumina-derived genome-copy estimates. At the 5,800 bp read-length cut-off, applied to maintain consistency with the mock-community analyses in this study, BASEN-nf and BASEN yielded lower L1 distances to the normalized Illumina depth profile than Kraken2 in all 19 samples (median L1: 0.153, 0.162 and 0.416, respectively). Both methods also yielded lower distances in all samples at the 20,000 bp cut-off, selected because read quality in the human stool samples began to decline beyond this length. Illumina depth provides a comparison derived from a separate sequencing platform, although it is not a ground truth and was measured over MAGs assembled from the same Illumina data.
- Read filtering has a limited effect on relative abundance. At the 5,800 bp cut-off, the filter removed a median 24.6% of classified reads, while 97% of species-by-sample abundance estimates changed by no more than 1 percentage point. Filtering slightly increased the distance to the Illumina profile relative to BASEN-nf in 18 of 19 samples; therefore, these data do not establish an improvement in abundance accuracy from filtering.
- Removed reads show lower taxonomic agreement with BLAST. In the cohort analysis of the five taxa with the largest mean abundance differences between Kraken2 and BASEN, removed reads showed lower BLAST agreement with the Kraken2 genus for four taxa after adjustment for read length and sample. In MCU22, 6% of removed Ruthenibacterium lactatiformans reads matched the expected genus, compared with 41% of retained reads, with lower agreement among removed reads in every length bin. Nevertheless, most removed reads agreed at genus level for four of the five cohort taxa, indicating enrichment for potential misassignments rather than uniform taxonomic disagreement.
Takeaway: BASEN profiles were closer to Illumina-derived genome-copy estimates than Kraken2 in all 19 samples. BLAST comparisons further showed lower agreement with the Kraken2 genus among filtered reads than among retained reads for four of the five cohort taxa, after adjustment for read length and sample. This supports enrichment of likely false-positive assignments among filtered reads, although most filtered reads still agreed at genus level for four of the five taxa.
Sample processing, comparisons with Illumina-derived profiles, BLAST analyses of filtered and retained reads, and study limitations are provided in Human stool analysis.
Code availability
- [GitHub] BASEN v1.0.0 (Base-level Abundance estimation with Species-assigned Evidence using Nanopore)
- [GitHub] Griffin-Pipeline: the Nanopore pipeline used here, from basecalling and QC to a custom Kraken2 database and classification.
- [Zenodo] Research reproducibility
References
-
De Coster et al. NanoPack: visualizing and processing long-read sequencing data. Bioinformatics 2018;34(15):2666-2669.
Ewels et al. MultiQC: summarize analysis results for multiple tools and samples in a single report. Bioinformatics 2016;32(19):3047-8.
Jain et al. High throughput ANI analysis of 90K prokaryotic genomes reveals clear species boundaries. Nat Commun 2018;9(1):5114.
Li. Minimap2: pairwise alignment for nucleotide sequences. Bioinformatics 2018;34(18):3094-3100.
Lu et al. Bracken: estimating species abundance in metagenomics data. PeerJ Comput Sci 2017;3:e104.
Shaw and Yu. Fast and robust metagenomic sequence comparison through sparse chaining with skani. Nat Methods 2023;20(11):1661-1665.
Wood et al. Improved metagenomic analysis with Kraken 2. Genome Biol 2019;20(1):257.
Youden. Index for rating diagnostic tests. Cancer 1950;3(1):32-5.
Abbreviations
Click to expand
-
ANI, average nucleotide identity
BASEN, Base-level Abundance estimation with Species-assigned Evidence using Nanopore
BASEN-nf, BASEN without read filtering
bp, base pair
CV, coefficient of variation
gDNA, genomic DNA
L1, sum of absolute differences between two compositions
MAG, metagenome-assembled genome
ONT, Oxford Nanopore Technologies
Q, Phred-scaled read quality (Dorado mean Q)
QC, quality control
SD, standard deviation