BASEN: Human stool analysis
This appendix evaluates BASEN in stool samples from 19 critically ill patients (ON-Time, Day 1). In the absence of a known community composition, methods were compared within each sample.
Contents
1. Data and processing
- Samples: stool from 19 critically ill patients on Day 1 (ON-Time; BioProject PRJNA1433842), each with nanopore (PromethION, SQK-NBD114-96) and Illumina reads. The cohort includes no healthy reference group; comparisons were restricted to methods within the same sample.
- Nanopore reads: reads were re-basecalled with Dorado sup v5.2.0; reads ≥ 100,000 bp and human reads were removed (68.1% of reads were human), and reads with mean Q ≥ 20 were retained. 2,090,485 reads were retained (host-free reads per sample 3,812–1,570,613, median 50,286). Two read-length cut-offs were evaluated: trimming at 5,800 bp (L5800, to maintain consistency with the mock-community analyses) and at 20,000 bp, beyond which read quality began to decline in these samples (L20000; 2,087,390 reads).
- Reference genomes: the 19 samples' Illumina reads were co-assembled (MEGAHIT) and binned (SemiBin2, seed 42); CheckM2 MIMAG medium quality (completeness ≥ 50%, contamination < 10%), GTDB-Tk, dereplicated at 95% ANI: 66 MAGs, one per species, genome lengths 0.44–5.74 Mb (13-fold), completeness 50.2–100.0% (median 84.7%). The 66 MAGs constituted the Kraken2 database.
- Four methods using the same Kraken2 classifications: Kraken2 (species-level read proportion), Bracken (each sample's median read length; species with < 10 reads excluded), BASEN-nf (BASEN without the read filter) and BASEN (read filter at unassigned 0.75 / Shannon 0.75, selected by inspecting the per-read k-mer distributions for these samples). BASEN's genome length is the MAG assembly length unless stated.
Read-filter thresholds for the human samples
- BASEN's read filter retains a read only if its fraction of unassigned k-mers is ≤
Uand the Shannon diversity of its assigned k-mers is ≤H. The standards use the package defaults,U = 0.5andH = 1.0, which the threshold grid on the mock data supported. - For the 19 stool samples the thresholds were set from these samples' own per-read distributions (below) instead, at
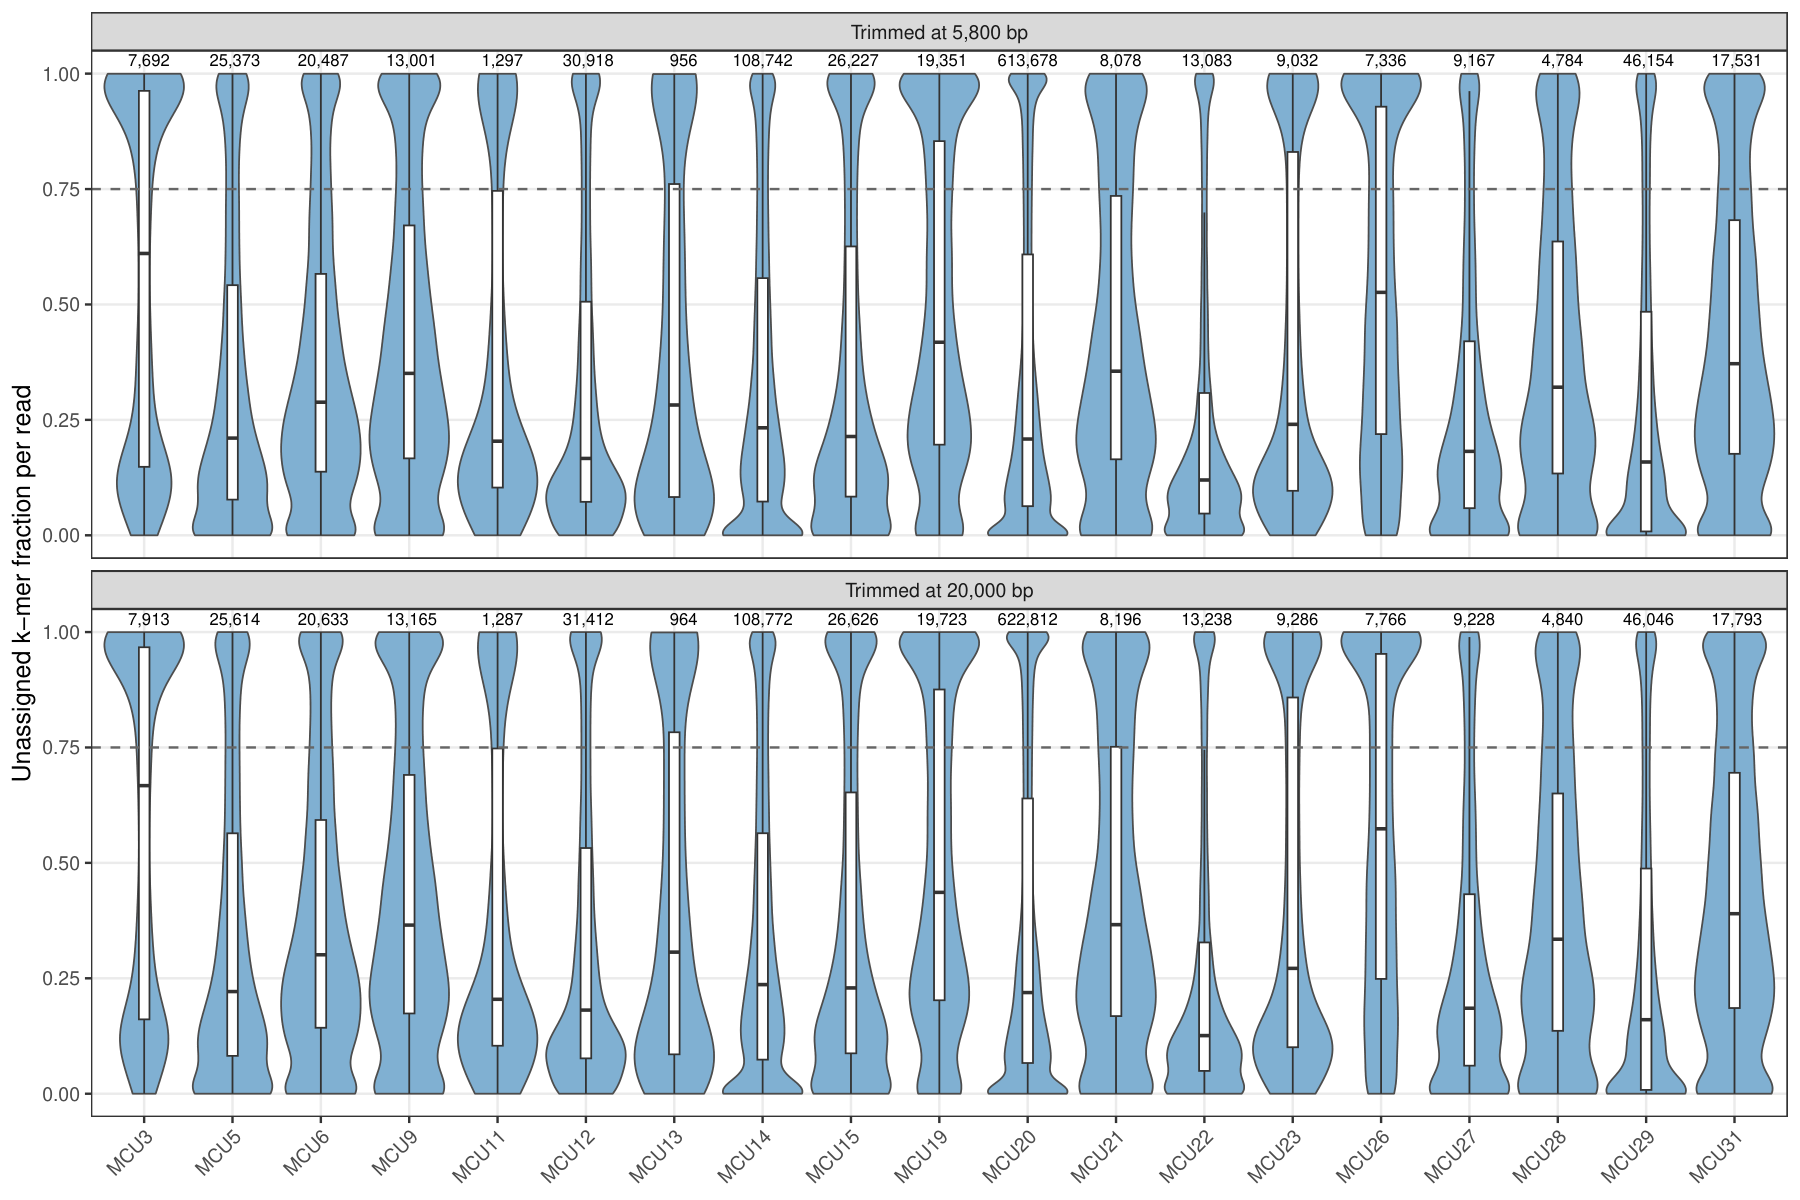
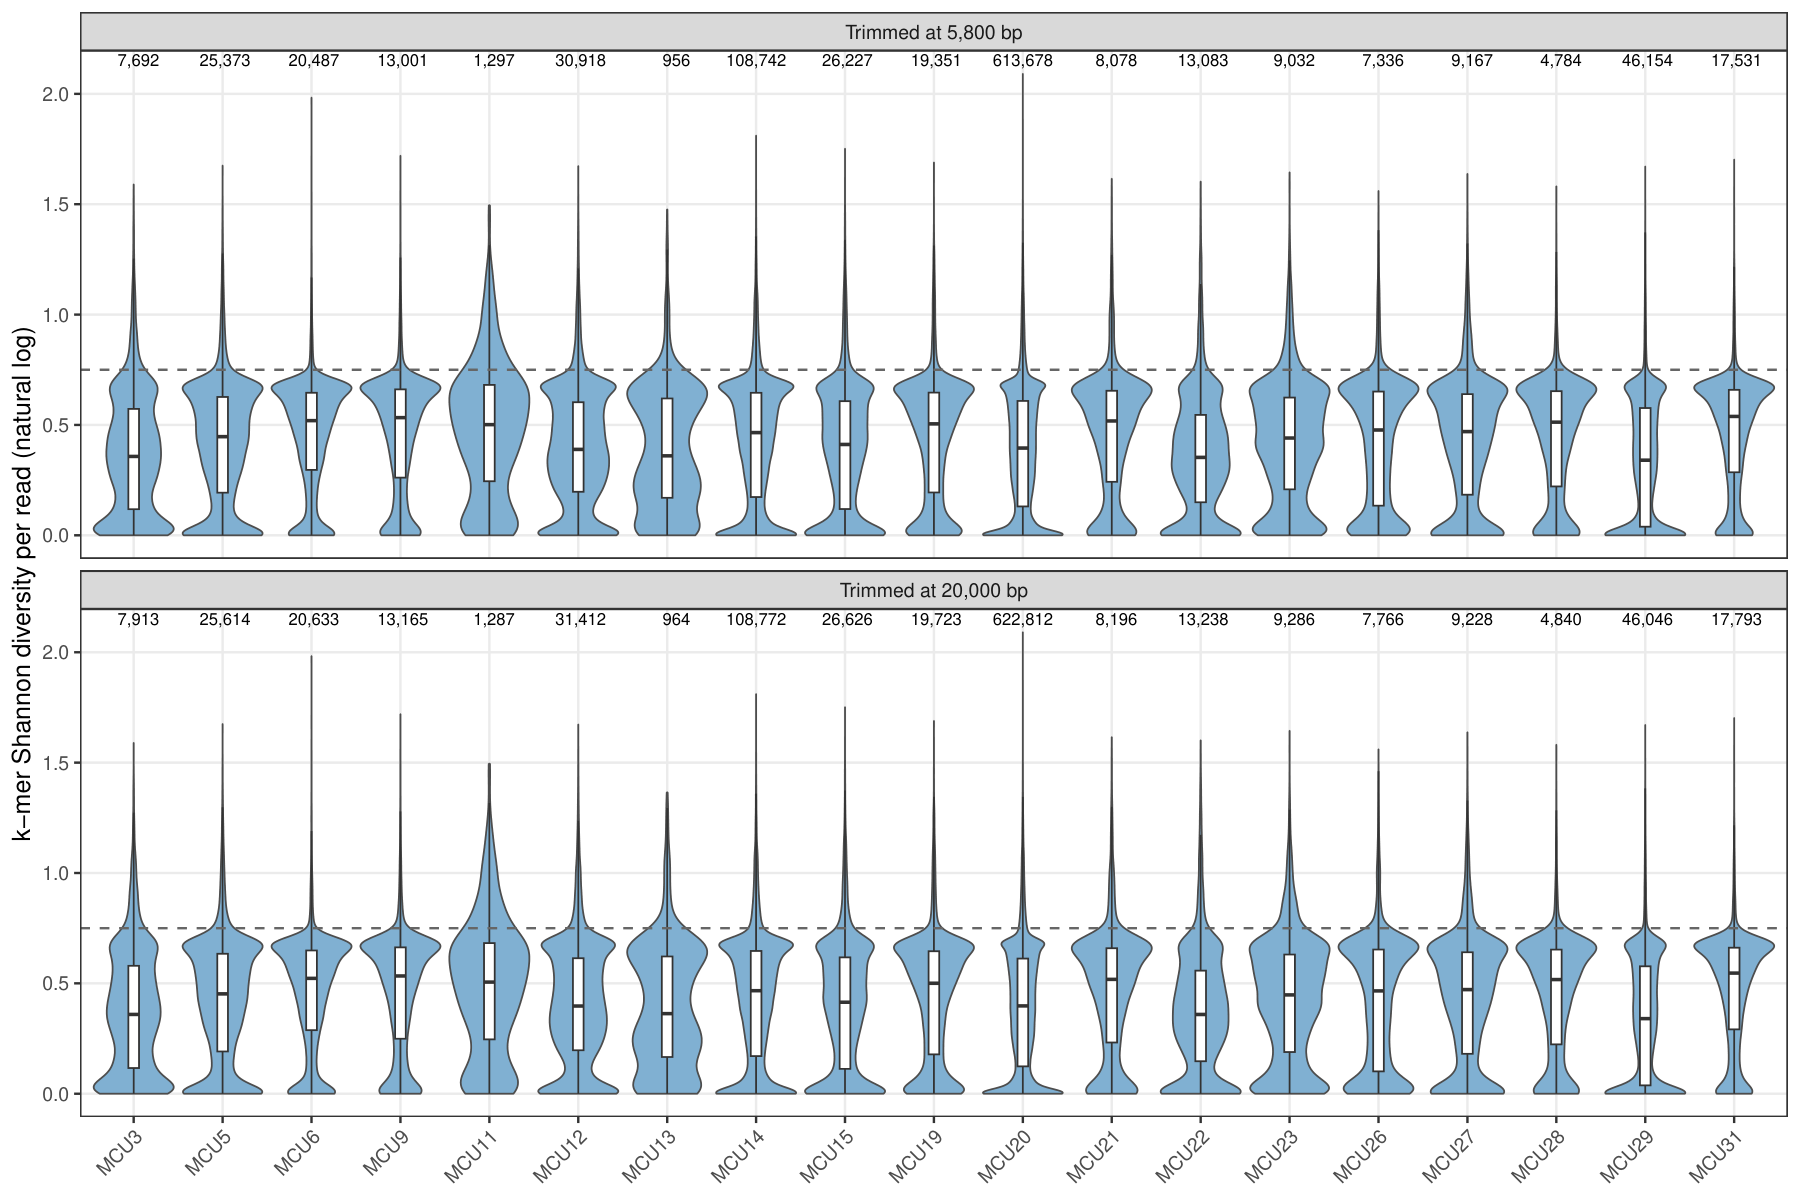
U = 0.75andH = 0.75, for both length cut-offs. The distributions of these metrics differed from those in the mock standards, where nearly every read originated from a reference genome:- Unassigned fraction: the per-sample median is 0.12–0.61 (L5800) and above 0.5 in 2 samples (MCU3, MCU26), so
U = 0.5would remove more than half of the classified reads in those samples. At 0.75, 12–45% of a sample's classified reads lie above the threshold. - Shannon diversity: the 95th percentile per sample is 0.69–1.00, so
H = 1.0would remove at most about 5% of a sample's reads. At 0.75, 3–16% of a sample's classified reads lie above it.
- Unassigned fraction: the per-sample median is 0.12–0.61 (L5800) and above 0.5 in 2 samples (MCU3, MCU26), so
- Input: classified Q ≥ 20 reads of each sample (Kraken2 against the 66 MAGs), the two per-read metrics from BASEN's
profile_kmer_composition().
2. Results
- Profiles
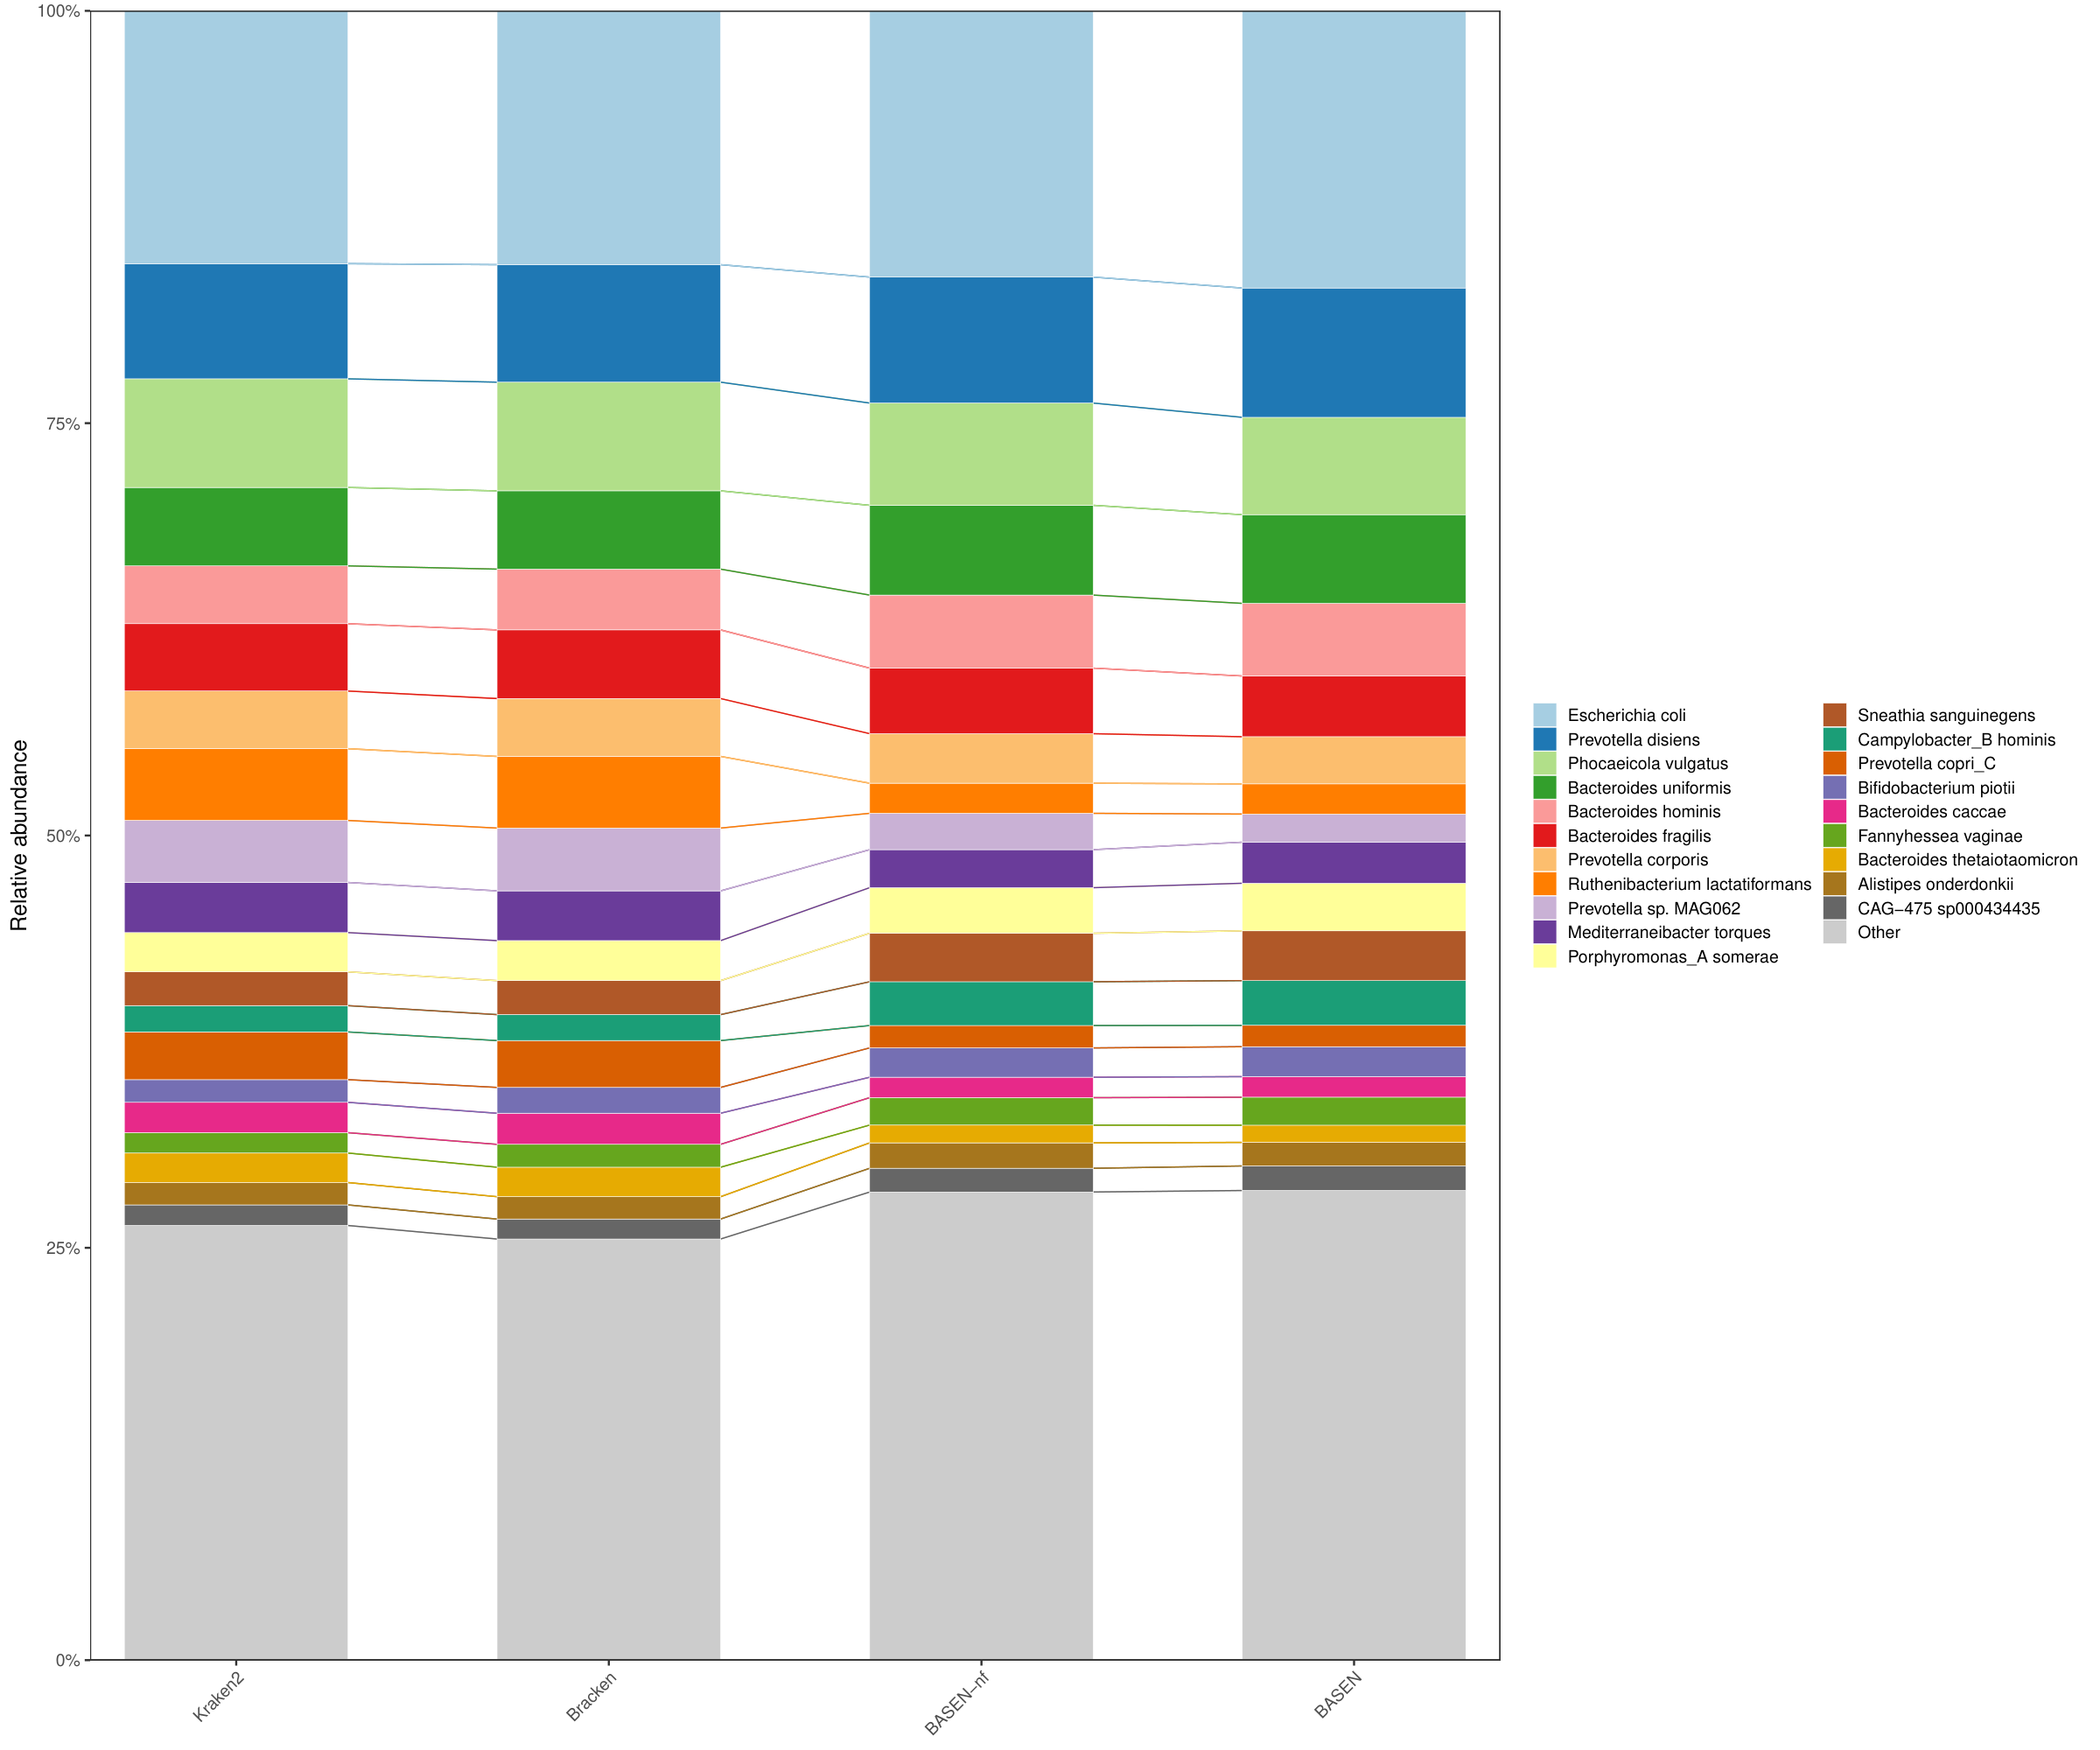
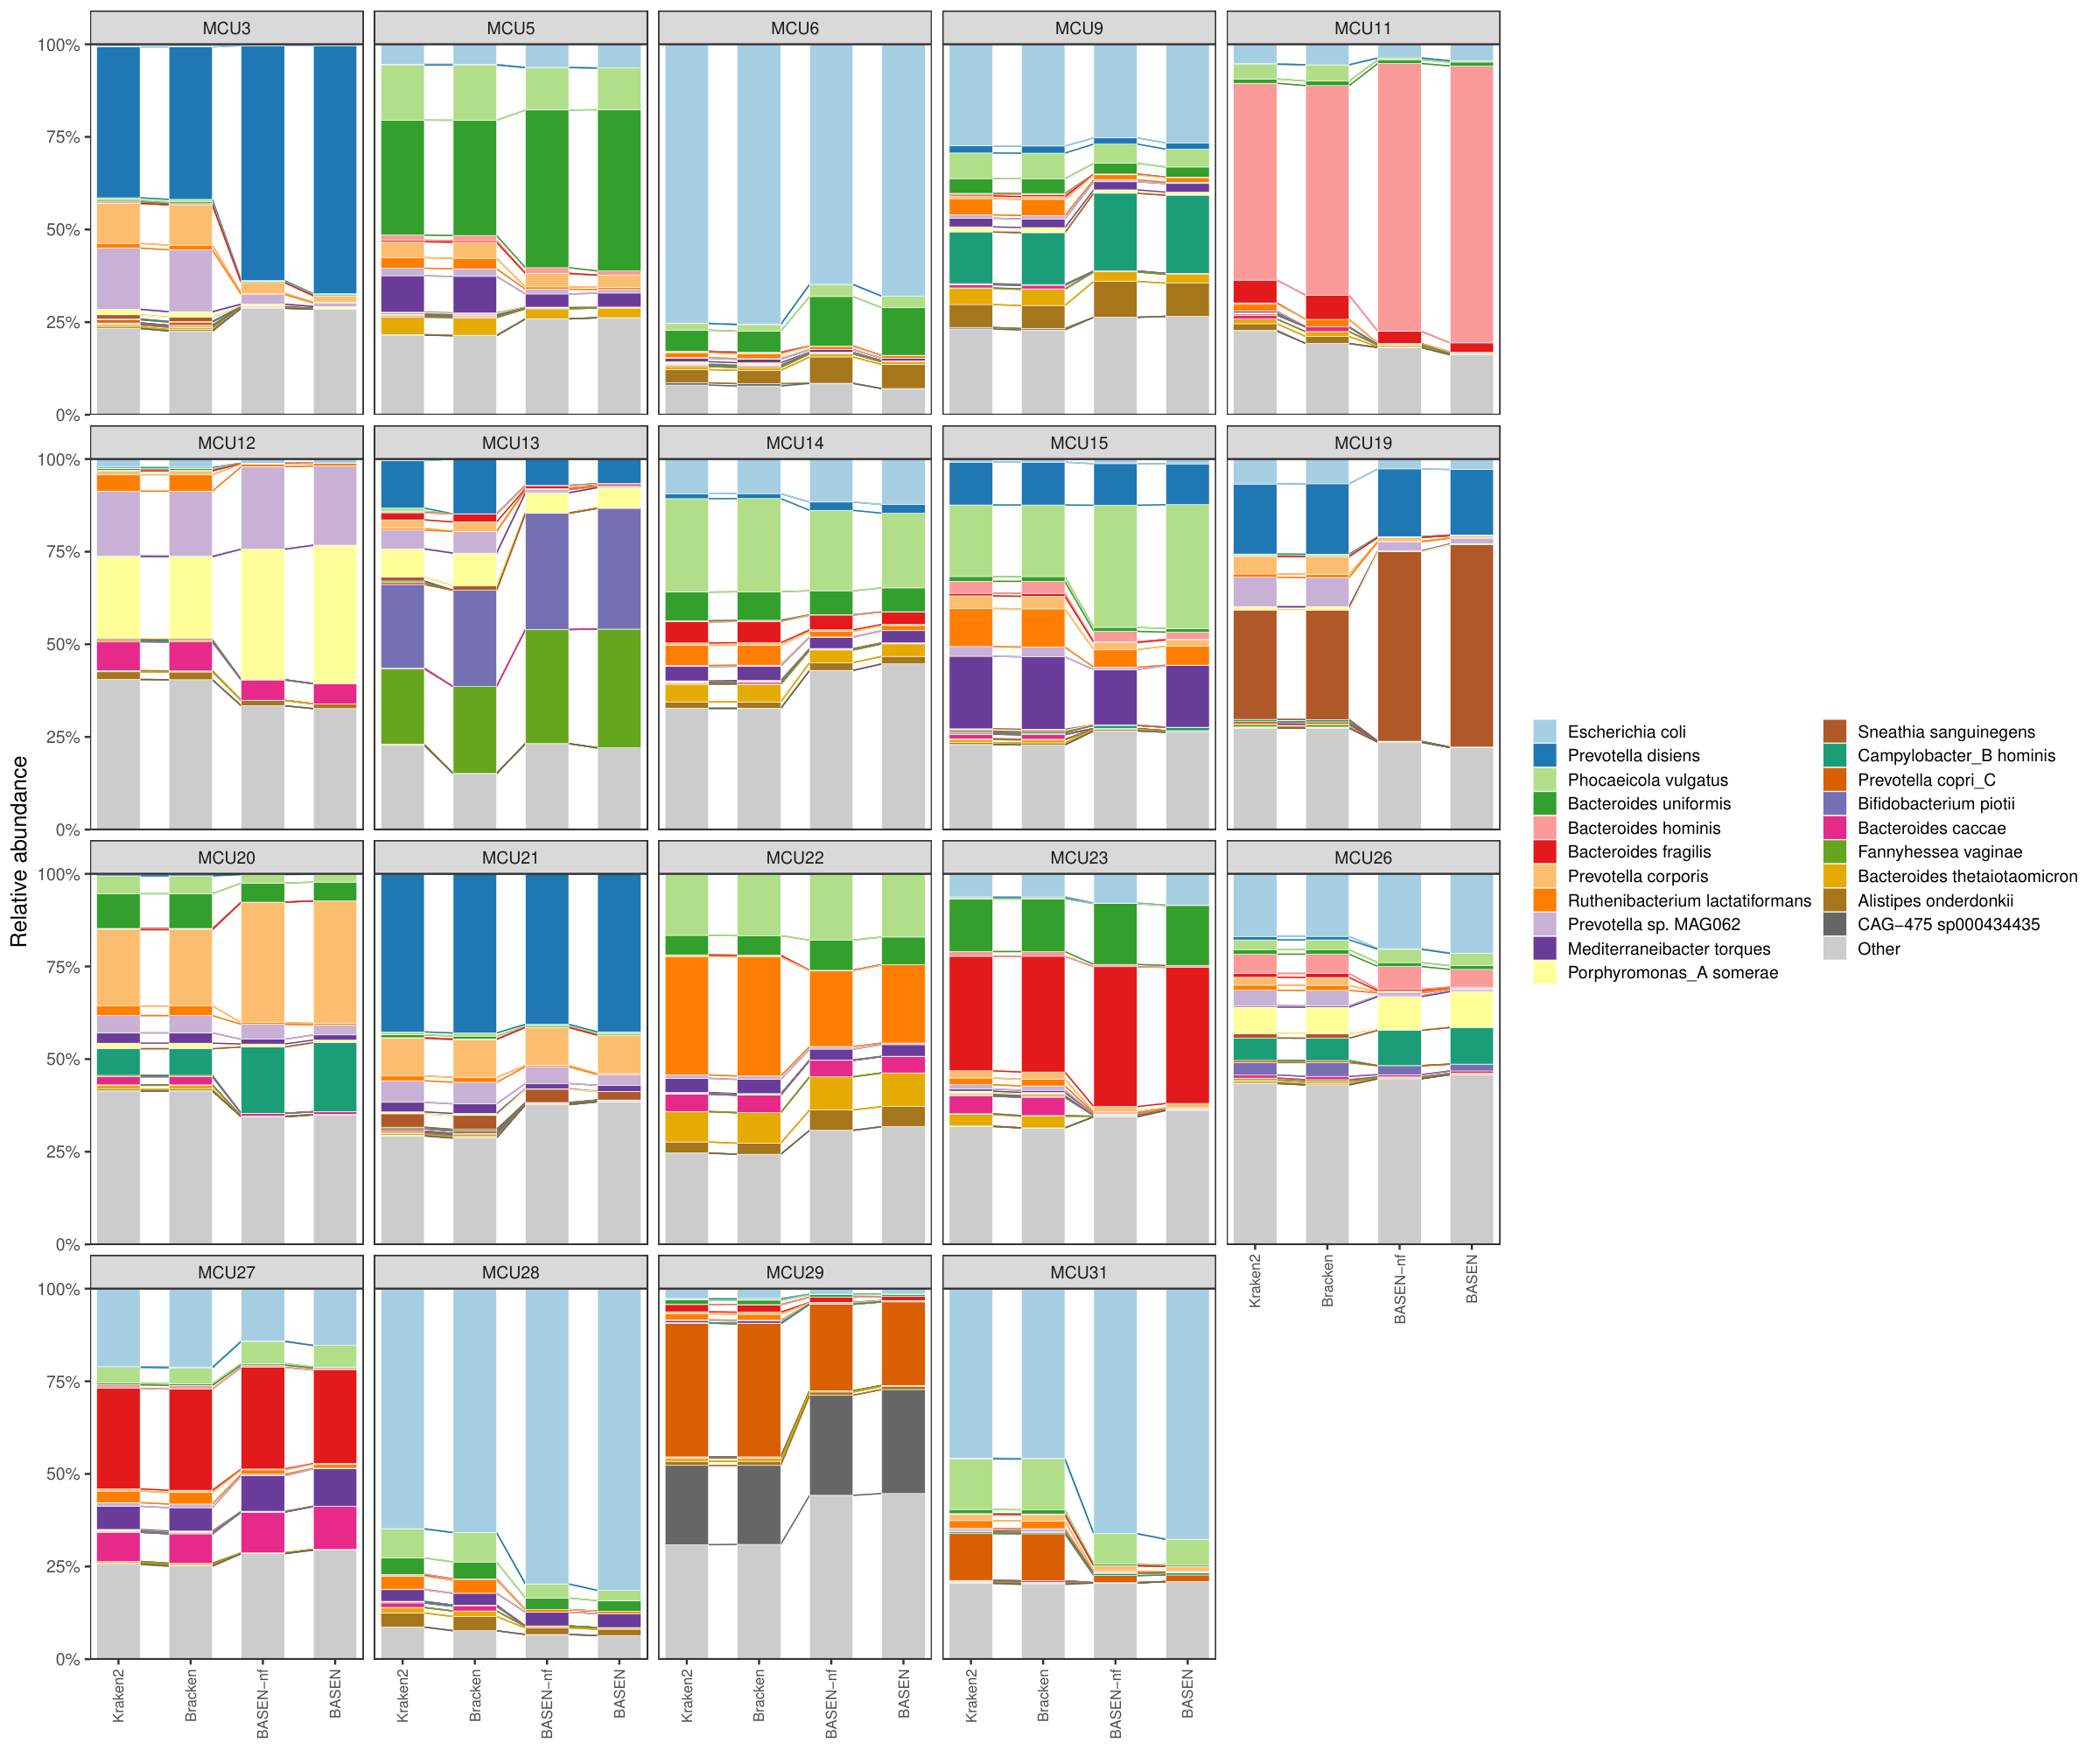
- Input: the 19 samples at L5800; the 20 species with the highest mean abundance (73% of total mean abundance), with the remaining species grouped as Other. Lines join a species across neighbouring bars.
- Dominant taxa differ in genome size (e.g. E. coli, P. corporis), providing a basis for differences between read proportions and genome-copy abundance.
- BASEN profiles more closely match Illumina-derived genome-copy estimates
- Input: the same 19 samples' Illumina reads mapped to the 66 MAGs (bowtie2, seed 42; primary alignments). Mean depth per MAG = the MAG's contig depths (samtools coverage) weighted by contig length, i.e. Illumina bases aligned to the MAG / MAG length; normalized over the 66 (share = depth / sum of the 66 depths), this provides a genome-copy reference derived from a separate sequencing platform, because depth measures coverage per reference base. The MAGs were assembled from these same Illumina data, so this reference is not an independent ground truth. Each nanopore profile is compared with it per sample:
L1 = sum |p - q|(0 = identical, 2 = disjoint) and Spearman rho over the 66 species. - BASEN-nf and BASEN were closer to the Illumina profile than Kraken2 in 19 of 19 samples at L5800 and 19 of 19 at L20000; Bracken showed a smaller reduction in median L1 than either BASEN variant.
- The read filter moved BASEN slightly away from Illumina (BASEN further than BASEN-nf in 18 of 19 samples at L5800, 18 of 19 at L20000; medians 0.153 vs 0.162).
- Read filtering removes a substantial fraction of reads while producing limited changes in relative abundance
- Input: BASEN-nf and BASEN profiles of the 19 samples. Per sample, the percentage of classified reads the filter removed and the profile shift
L1(BASEN-nf, BASEN); per species and sample, the percentage of its reads removed and the change in its relative abundance. Share (here and below) = a species' estimated percentage of genome copies represented by the reference database, obtained by normalizing its assigned sequence evidence by genome length. It is BASEN's relative abundance, which differs from the relative abundance read-count tools report (Kraken2, Bracken: a species' percentage of the classified reads, i.e. of the DNA): a species with a large genome yields more reads per cell, so its read proportion can exceed its genome-copy proportion. Formally, for BASEN-nf or BASEN:share_s = (B_s / G_s) / sum_j (B_j / G_j), whereB_s= k-mers of the sample's classified reads assigned to species s (BASEN'sbases_assigned; for BASEN, only reads that pass the filter) andG_s= MAG length − k + 1 (k = 35). Removing reads changes a share only if the species loses a different fraction of itsB_s / G_srelative to the rest of the sample: proportionally lower loss increases its share, whereas greater loss decreases it. - Per sample the filter removed a median 24.6% of classified reads (17.2–49.8%) at L5800 and 26.1% (17.9–52.3%) at L20000; the profile shifted by a median L1 of 0.067 (0.037–0.101) and 0.092.
- For example, in MCU22 R. lactatiformans: the filter removed 12.2% of its reads (4,163 to 3,657), while its estimated share changed from 20.5% to 21.1%, because read filtering also reduced evidence assigned to other taxa in the sample.
- 97% of species-by-sample shares changed by 1 percentage point or less (L20000 96%); the largest change was 3.6 points (4.9 at L20000).
- Removal is not uniform across taxa (over all samples at L5800: Prevotella sp. MAG062 57%, R. lactatiformans 44%, E. coli 14%), motivating the BLAST comparisons below.
- BLAST assessment of filtered reads in an example sample: MCU22 R. lactatiformans
- Input: the example above. In MCU22 Kraken2 assigned 4,163 reads to R. lactatiformans; BASEN's read filter removed 506 of them (L5800). Two sets of reads were searched against NCBI core_nt (megablast, at most 10 hits per read) and classified using their highest-scoring reported hits: removed by BASEN (all 506) and retained by BASEN (as many, drawn at random from the reads the filter retained; seed 42). Both sets are reads Kraken2 counts for R. lactatiformans; only the retained set counts in BASEN. In the text below and in sections 5–7, "removed reads" and "retained reads" are short for these two sets. Reads removed by BASEN are longer, so (B) compares the two sets within read-length bins. Bins were defined using the 20th, 40th, 60th and 80th percentiles of the two sets' pooled read lengths (each bin holds about a fifth of the reads; the same bins for both sets, so they are compared over the same lengths). At L5800 the cut points are 288, 972 and 2,922 bp: a cut point falls between two read lengths (the 20th percentile is 288.2 bp), so one bin ends at 288 and the next starts at 289. The 80th percentile and the maximum are both 5,800 bp, because over a fifth of the reads were trimmed to exactly 5,800 bp, so those two bins merge and L5800 has 4 bins; L20000 has 5.
- In (A): of the reads removed by BASEN, 6% matched Ruthenibacterium and 63% hit a single other genus, most often Bacteroides or Phocaeicola. Of the reads retained by BASEN, 41% matched Ruthenibacterium. As a 2 × 2 table (expected genus vs the rest, retained vs removed by BASEN: 208 / 298 vs 32 / 474), Fisher's exact test (two-sided) yielded a p-value = 1.5 × 10-41, odds ratio 0.10 (L20000: p-value = 1.0 × 10-40).
- In (B): reads removed by BASEN are longer (median 3,225 vs 798 bp), but within every length bin the blue (expected) part is smaller for them: 5–10% vs 29–57% per bin (L20000 3–9% vs 30–53%). Adjusted for read length, the odds that a read removed by BASEN agrees with Kraken2 are 0.07 times those of a read retained by BASEN (95% CI 0.05–0.11; L20000 0.08).
- Thus, reads assigned by Kraken2 to R. lactatiformans and removed by BASEN were predominantly assigned to other genera by BLAST, and removing them still left its relative abundance largely unchanged. Reads retained by BASEN also agree in fewer than half of cases; see the note on the MAG in the cohort comparison below. Underlying outputs:
blast_mcu22_rlactatiformans.tsv,_genera.tsv,_bylength.tsv. - Patient-level BLAST assessment of the three species with the largest abundance differences
- Input: for each of the 19 patients, the 3 species with the largest |Kraken2 − BASEN| in that patient (57 patient-by-species pairs at L5800). For each pair, the reads removed by BASEN and as many reads retained by BASEN (seed 42), searched and called as in the MCU22 example. 28 pairs were already covered by the cohort search below; the other 29 (23 species) were searched for this check.
- Gap per patient = % of reads removed by BASEN in the Kraken2 genus minus % of reads retained by BASEN (sampled), pooled over the patient's top 3 (L5800), with its 95% CI. The three displayed patients were ranked by the confidence-interval bound nearest zero to emphasize gaps supported by greater precision (MCU13 has the largest point gap but only 30 removed reads).
- In all three patients, reads removed by BASEN show lower agreement with the Kraken2 genus than retained reads, for each of their top 3 species. The largest differences were observed for two species: R. lactatiformans (MCU22 6% vs 41%; MCU15 17% vs 66%) and Mediterraneibacter torques (MCU5 23% vs 93%; MCU15 46% vs 91%). The other species (Alistipes onderdonkii, Alistipes putredinis, Bacteroides uniformis, Phocaeicola vulgatus) showed predominantly concordant genus assignments in both sets.
- Over all 19 patients: removed reads agreed less than retained reads in 42 of 55 patient-by-species pairs; the patient-level gap is below zero with its entire CI in 11 of 19 patients (L20000: 10) and above zero in 2 (MCU29, MCU3), driven by Prevotella species (P. disiens and Prevotella sp. MAG062 in MCU3, P. copri_C in MCU29); in the cohort comparison below, P. disiens also showed the reverse pattern and MAG062 is mixed across samples.
- Per pair, Fisher's exact test of removed vs retained reads (Kraken2 genus vs the rest; two-sided, no correction for the 55 pairs): p-value < 0.05 in 40 pairs, with removed reads agreeing less in 31 and more in 9. Of those 9, five (Prevotella species in MCU3, MCU9, MCU19, MCU21, MCU29) were no longer observed when restricting the comparison to reads with a BLAST hit (the two sets then agree about equally); there the retained reads, which are shorter, more often had no hit. Four showed the reverse pattern even among reads with a BLAST hit: E. coli in MCU27 and MCU31, Porphyromonas sp902489445 in MCU20 and Prevotella sp. MAG062 in MCU3. Per pair:
blast_donor_top3.tsv(columnp_fisher). - Taxonomic composition of filtered reads assessed by BLAST
- Input: the reads Kraken2 assigned to a taxon but the filter removed, for the five taxa with the largest mean |Kraken2 − BASEN| difference over the 19 patients. Each read was searched against NCBI core_nt (megablast, at most 10 hits per read) and classified using its highest-scoring reported hits at genus level and, where the MAG has an NCBI species name, at species level.
- Agreement: the highest-scoring reported hits fall in the Kraken2 genus. MAGs use GTDB nomenclature, whereas BLAST results use NCBI nomenclature; for Kraken2 genus Prevotella, NCBI Segatella and Hoylesella (genera NCBI split from Prevotella) were treated as concordant. The strict name match is shown alongside.
- Genus: for 4 of 5 taxa, 72–89% of the removed reads were assigned by BLAST to the Kraken2 genus (L5800).
- Species: agreement is lower (Escherichia coli 81%, Phocaeicola vulgatus 35%, Ruthenibacterium lactatiformans 2%, Prevotella disiens 0%); many removed reads were assigned by BLAST to a related species within the same genus (e.g. P. vulgatus reads hitting P. dorei).
- R. lactatiformans is the exception (2% agree at genus level): its filtered reads predominantly matched other genera (top: Bacteroides 23%).
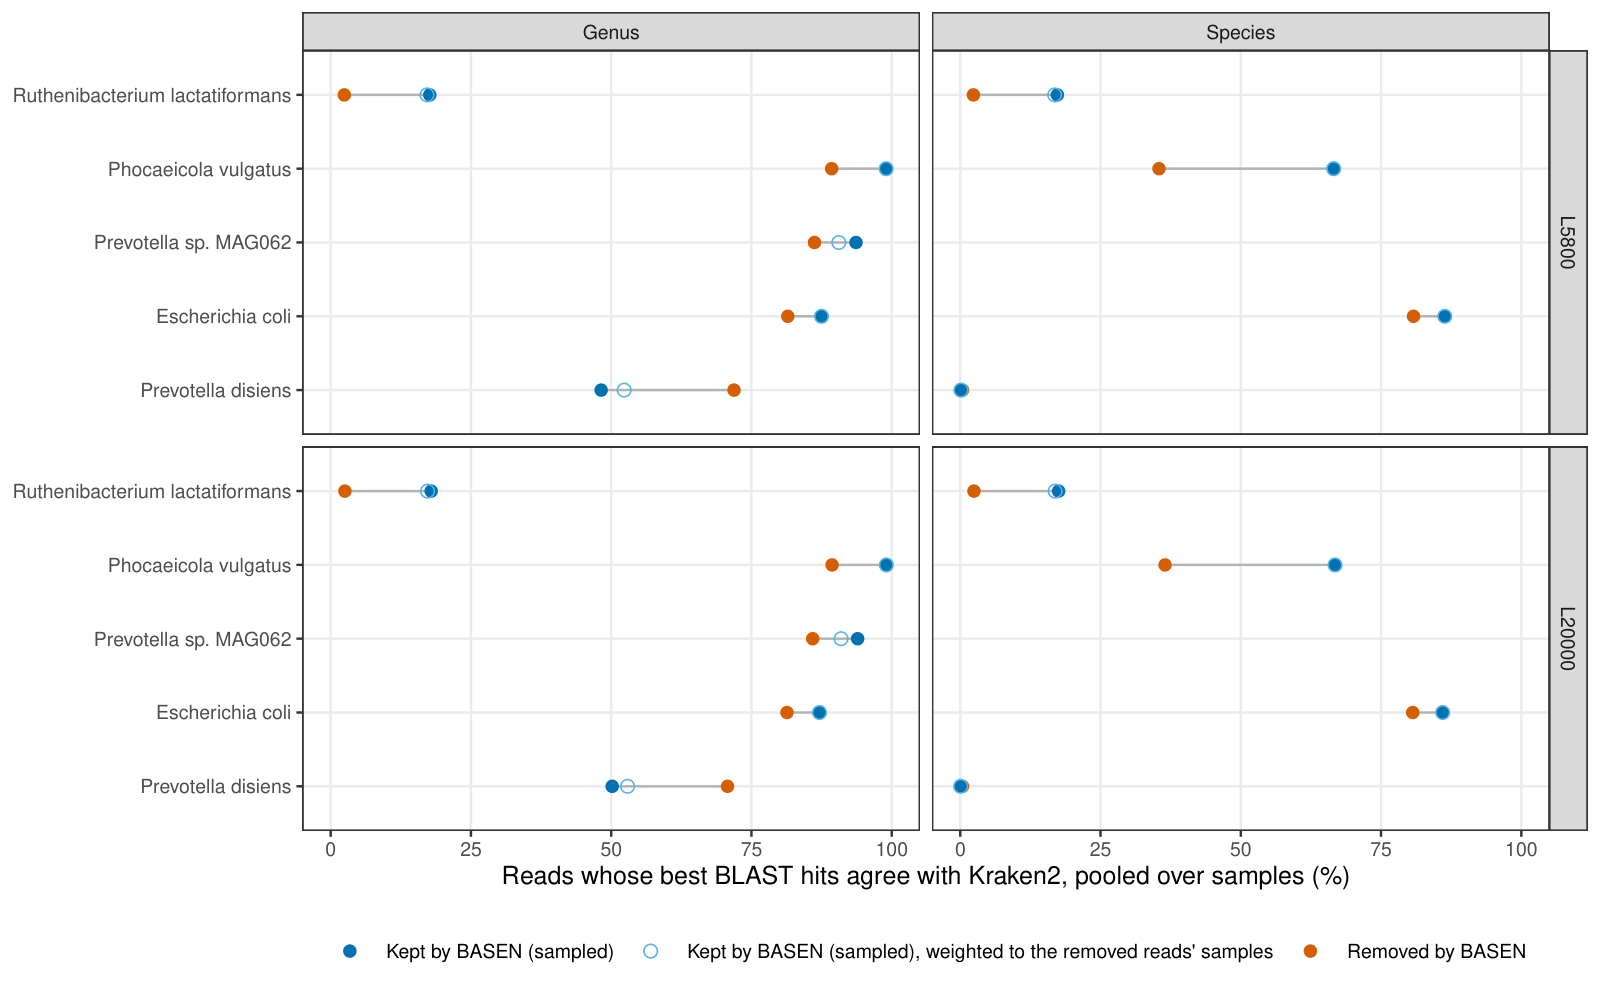
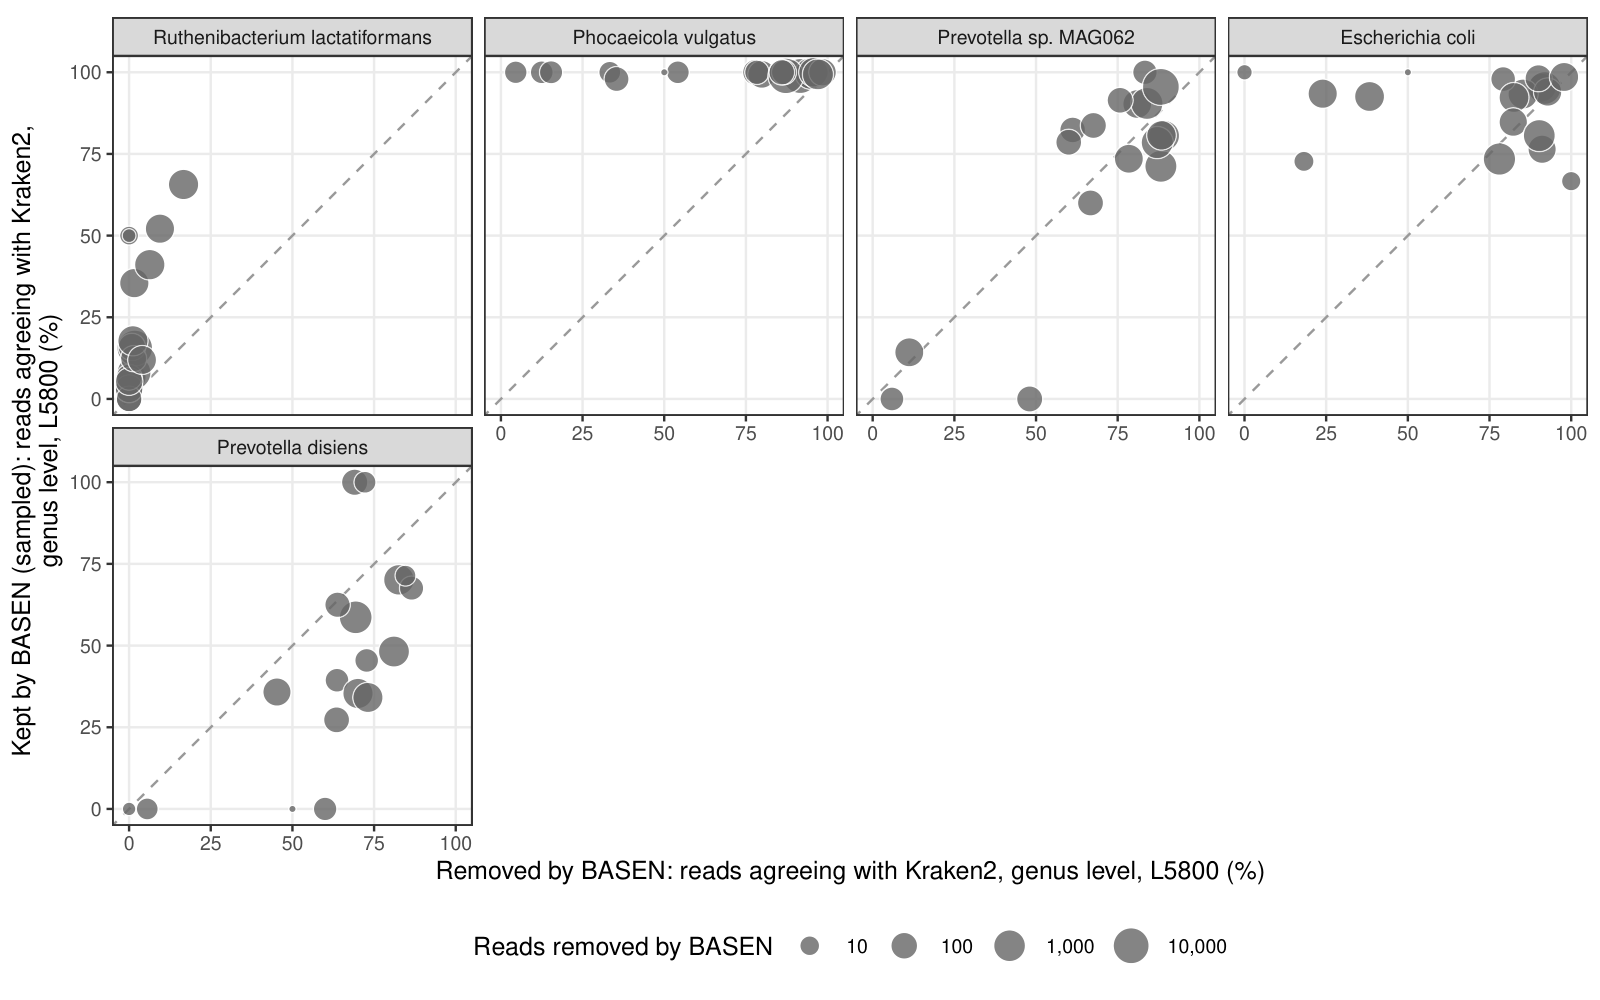
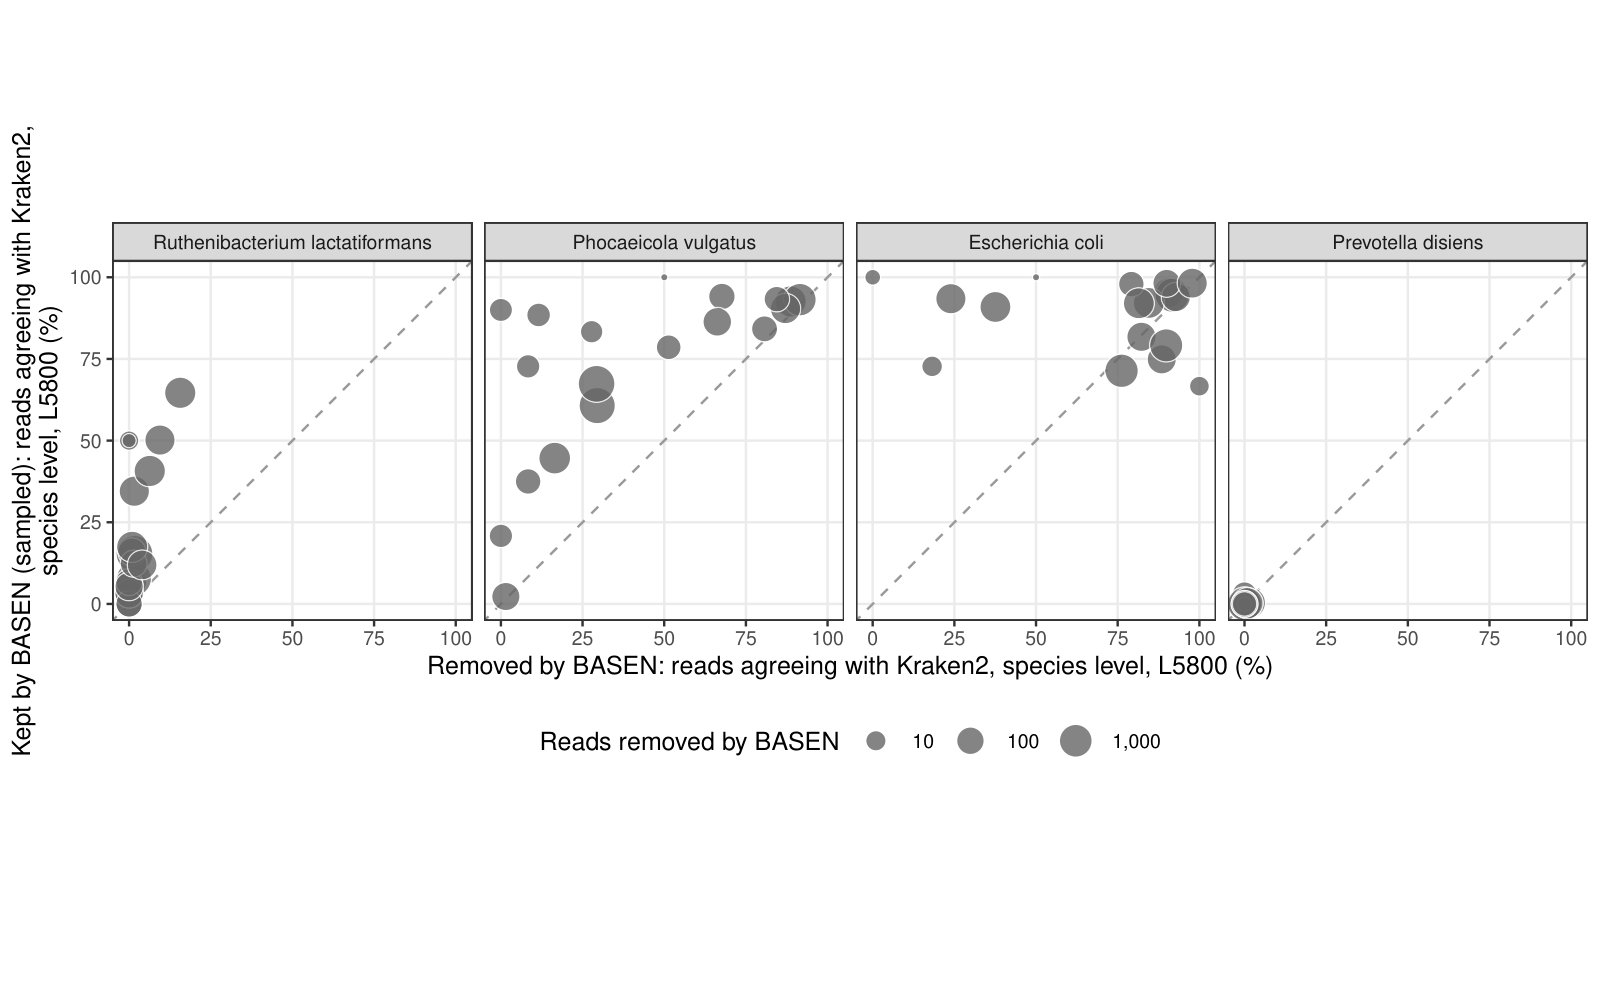
- Filtered reads show lower BLAST agreement with Kraken2 assignments than retained reads
- Input: reads retained by BASEN (sampled), drawn for each taxon and sample in the same number as the reads removed by BASEN (seed 42; all retained reads where fewer retained reads were available: 42 of 95 taxon-by-sample cells at L5800), searched and called the same way. Compared at two levels: pooled over the 19 samples (cohort) and per sample (individual).
- Retained reads are shorter than removed reads (taxon-level medians 326–3,193 vs 960–5,798 bp), so the comparison is also made with a logistic regression of agreement on set, log10 read length and sample (odds ratio removed vs retained; < 1 = removed reads agree less).
- Genus: removed reads agreed less than retained reads for 4 of 5 taxa after adjusting for length and sample (L20000: 4 of 5); P. disiens showed the reverse, because 43% of its short retained reads had no BLAST hit (among reads with a hit: 76% vs 84%).
- Species: removed reads agreed less for 3 of 4 taxa; P. disiens reads matched NCBI P. disiens in under 1% of reads in either set (0.4% vs 0.2%), limiting interpretation at species level.
- The pattern holds in individual samples, not only in the pooled reads: e.g. P. vulgatus in 19 of 19 samples and R. lactatiformans in 17 of 19; it is mixed for Prevotella sp. MAG062 (9 of 17).
- Even retained R. lactatiformans reads agreed with Ruthenibacterium in only 18% of reads; the MAG (5.74 Mb, 349 contigs) may carry sequence from other genera. Potential cross-genus sequence content has not been assessed.
- Effect of completeness adjustment on MAG genome-length normalization
- Input: BASEN-nf and BASEN with the genome length taken as the MAG assembly length, or as assembly length / CheckM2 completeness (larger for incomplete MAGs); both compared with the Illumina depth profile.
- Length / completeness was further from Illumina (median L1 at L5800: BASEN-nf 0.214 vs 0.153, BASEN 0.227 vs 0.162); it was closer in only 2 and 3 of 19 samples.
- Reads originating from regions absent from a MAG cannot match those missing reference regions. The bases BASEN counts come from the assembled part only, and dividing by the assembly length estimates coverage over the represented sequence; dividing by length / completeness includes unrepresented sequence in the denominator and can underestimate abundance for incomplete MAGs.
- The Illumina depth is also computed on the same assemblies, so this comparison does not independently validate the choice of denominator.
- Contributions of genome length and read-level evidence to abundance differences
- Input: per species and sample,
log2(BASEN-nf share / Kraken2 share)against MAG genome length. BASEN-nf differs from Kraken2 by the species' bases per read divided by its genome length, so the plot shows which of the two drives the shift. - Genome length showed little monotonic association with the abundance shift (per-sample Spearman rho median -0.07, range -0.40 to 0.30 at L5800); within one MAG the shift varies by several log2 units between samples. In these samples, variation in assigned sequence evidence per read contributed more strongly to the abundance shift than genome length.
- This analysis describes the origin of abundance differences without establishing their accuracy. The Illumina comparison above provides a separate assessment of agreement with genome-copy estimates.
- Sensitivity of abundance estimates to the read-length cut-off
- Input: each sample's L5800 and L20000 profiles;
L1(L5800, L20000)per method. - Median L1: Kraken2 0.012, Bracken 0.012, BASEN-nf 0.052, BASEN 0.055. Trimming changes the sequence evidence per read while largely preserving read counts, producing larger shifts in BASEN profiles for taxa with atypical read-length distributions (MCU22 R. lactatiformans, whose reads are of typical length: BASEN 21.11% vs 21.08%).
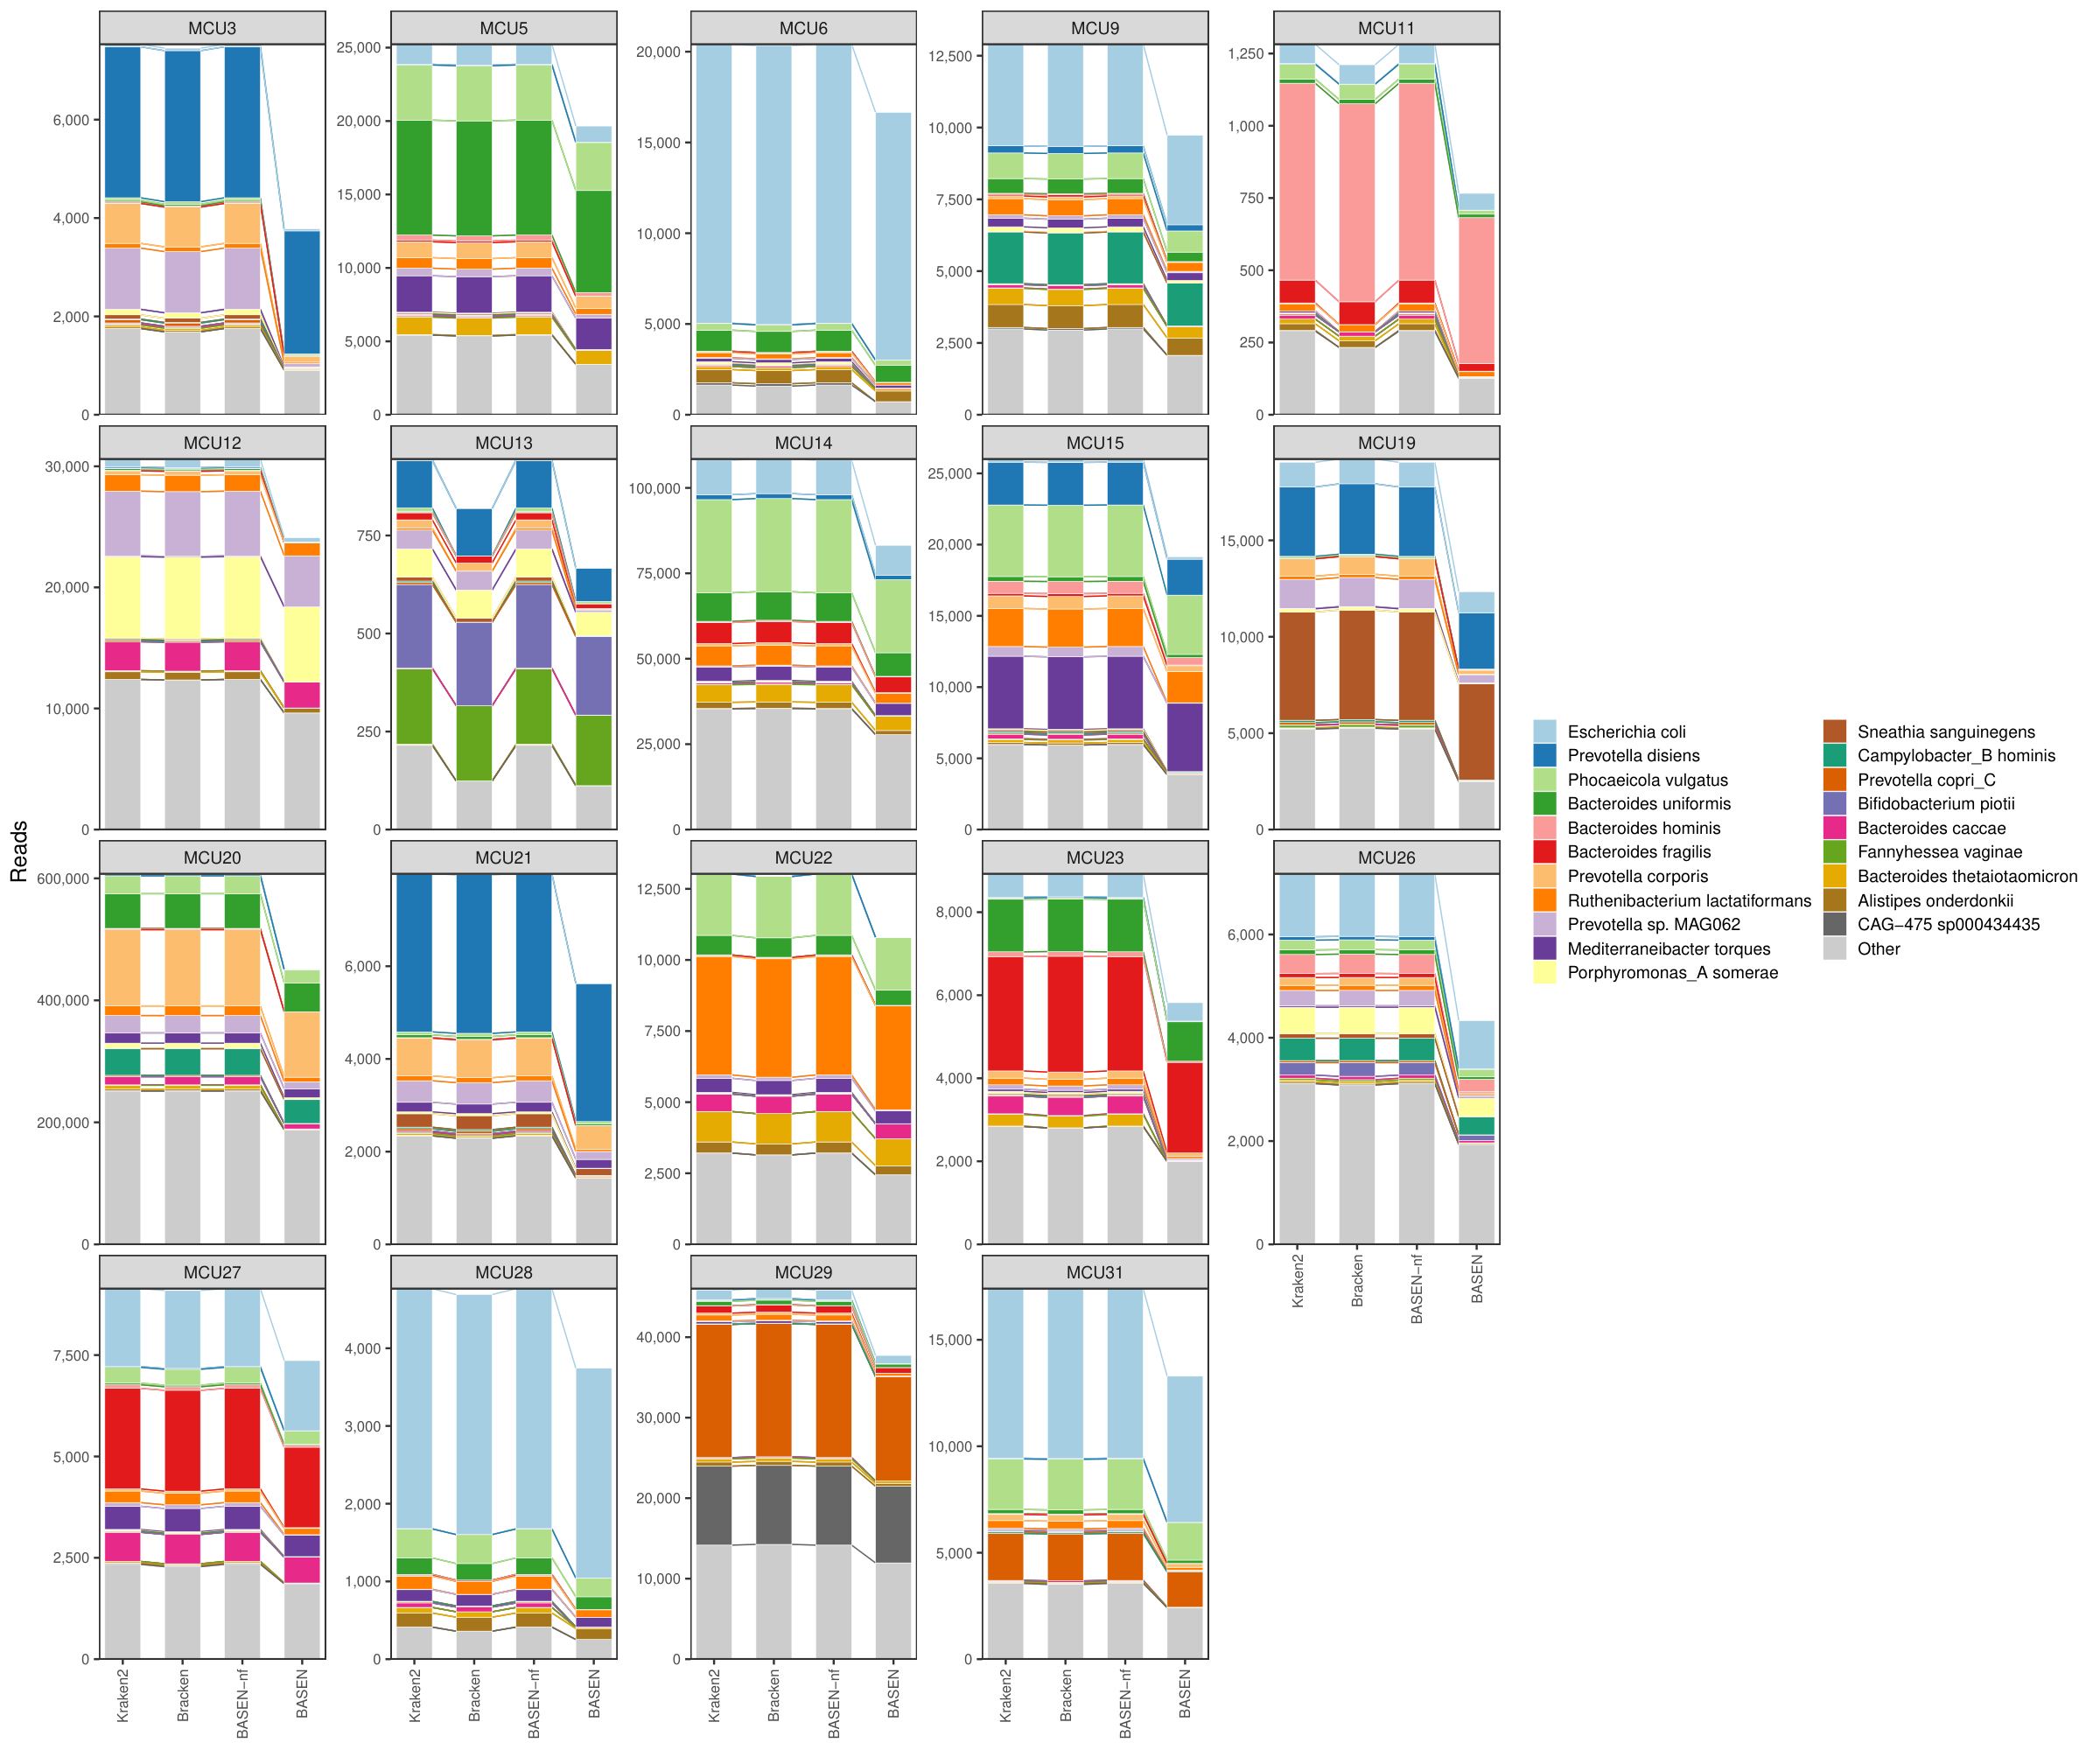
Takeaway: Read proportions and genome-copy abundance describe distinct aspects of community composition; both the abundance profiles and their supporting read counts should be considered.
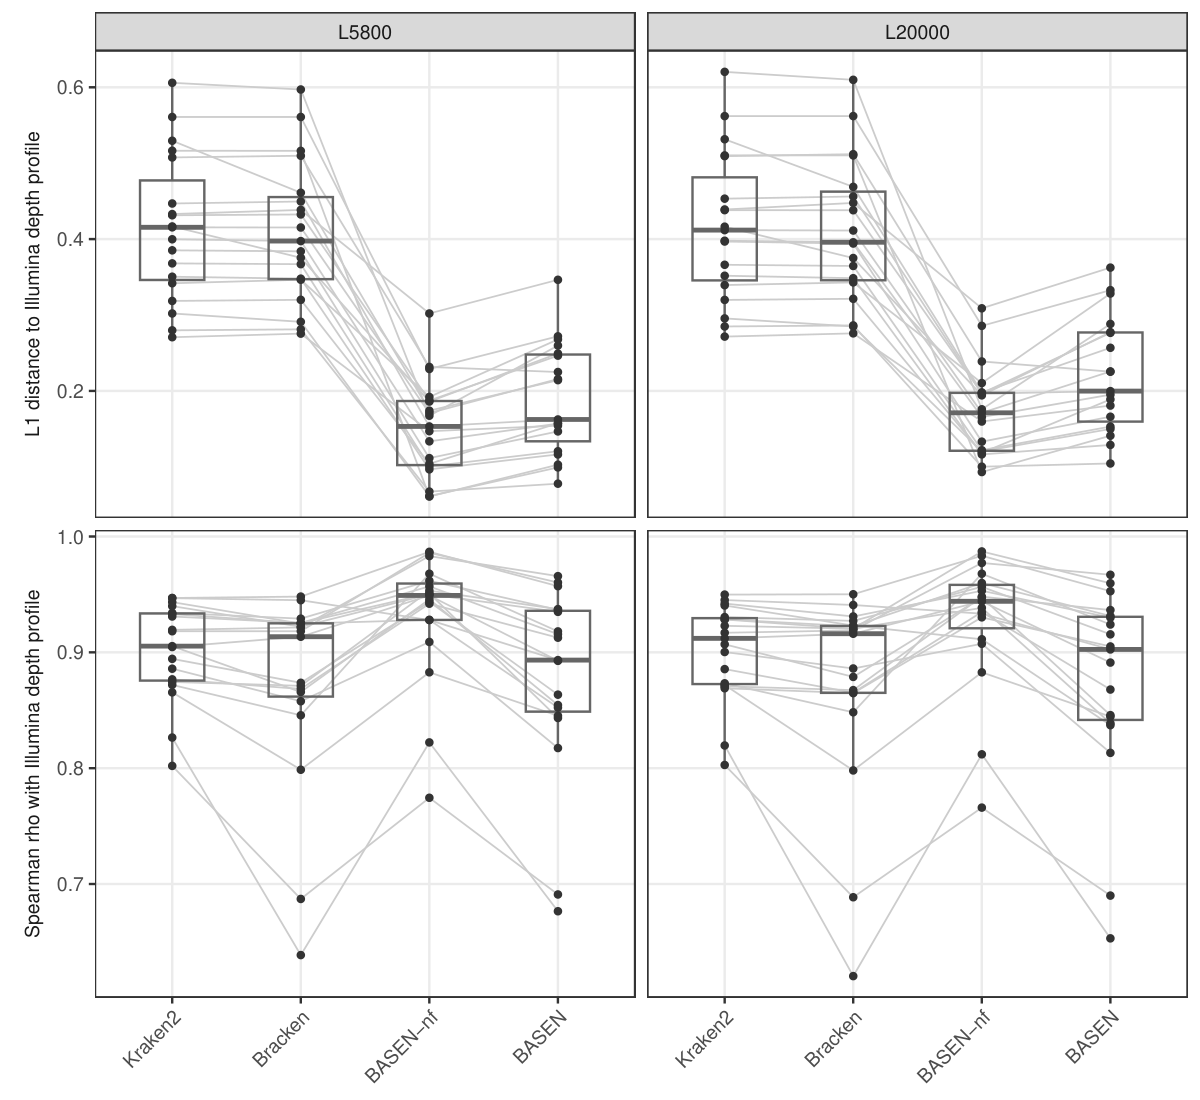
One point per sample; grey lines join a sample across methods. Top: L1 to the Illumina depth profile (lower = closer). Bottom: Spearman rho with it (higher = same ranking).
| Method | L5800 | L20000 | ||
|---|---|---|---|---|
| median L1 | median rho | median L1 | median rho | |
| Kraken2 | 0.416 | 0.91 | 0.412 | 0.91 |
| Bracken | 0.397 | 0.91 | 0.396 | 0.92 |
| BASEN-nf | 0.153 | 0.95 | 0.171 | 0.94 |
| BASEN | 0.162 | 0.89 | 0.200 | 0.90 |
Takeaway: BASEN-nf and BASEN yielded lower L1 distances to the Illumina-derived profile than Kraken2 in all samples at both cut-offs. Read filtering slightly increased the distance relative to BASEN-nf.
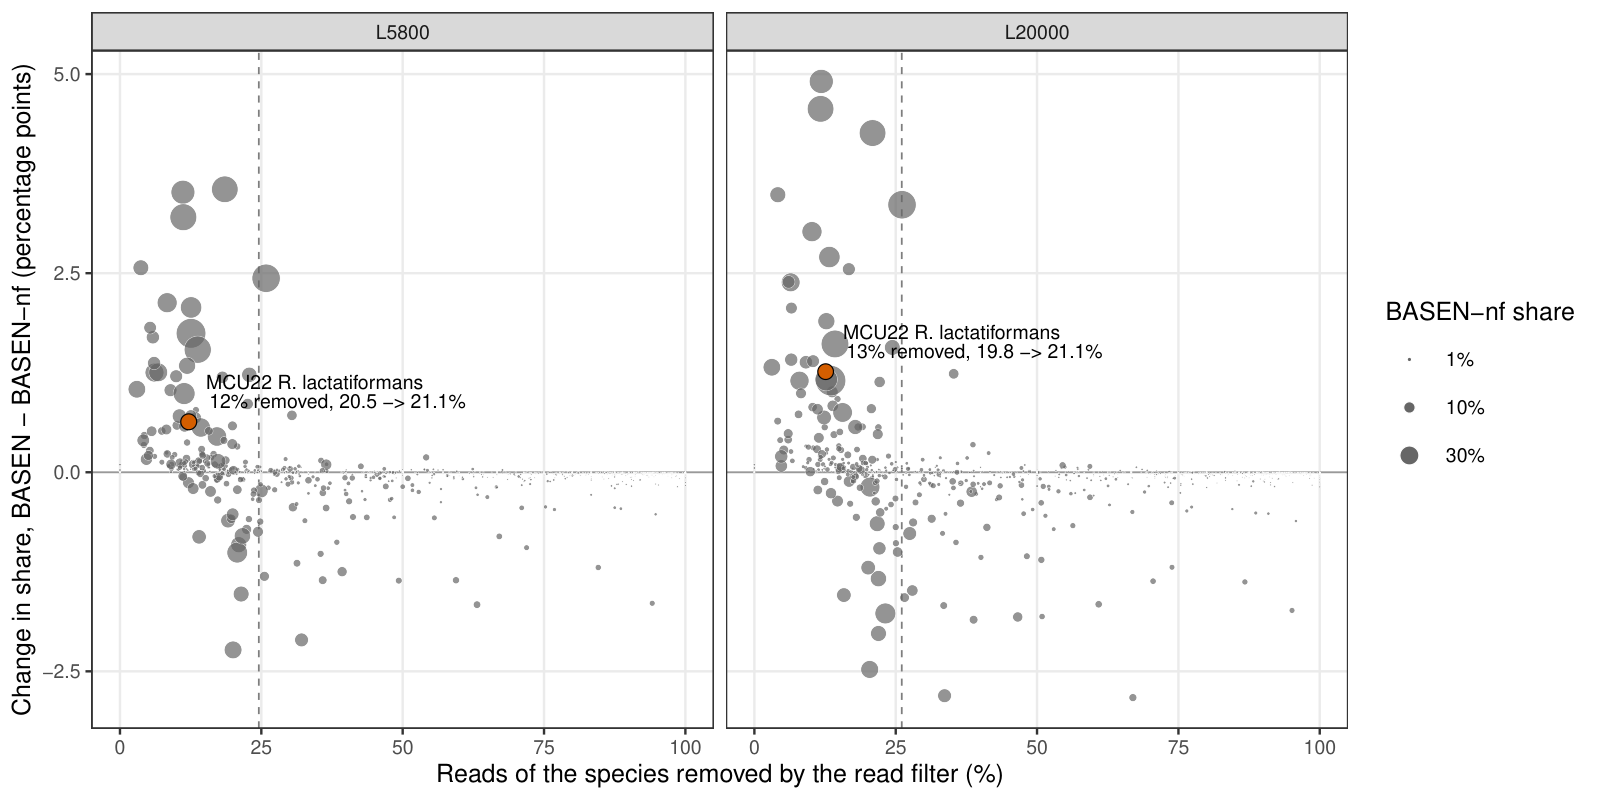
One point per species and sample (point size = its BASEN-nf share). x: reads of the species removed by BASEN's read filter; y: change in its share, BASEN minus BASEN-nf (percentage points). Dashed line: median share of classified reads removed per sample. Orange: MCU22 R. lactatiformans.
Takeaway: At L5800, the filter removed a median 24.6% of classified reads, while 97% of species-by-sample abundance estimates changed by no more than 1 percentage point. Relative abundance changes depend on differential loss of species-assigned evidence rather than read removal alone.
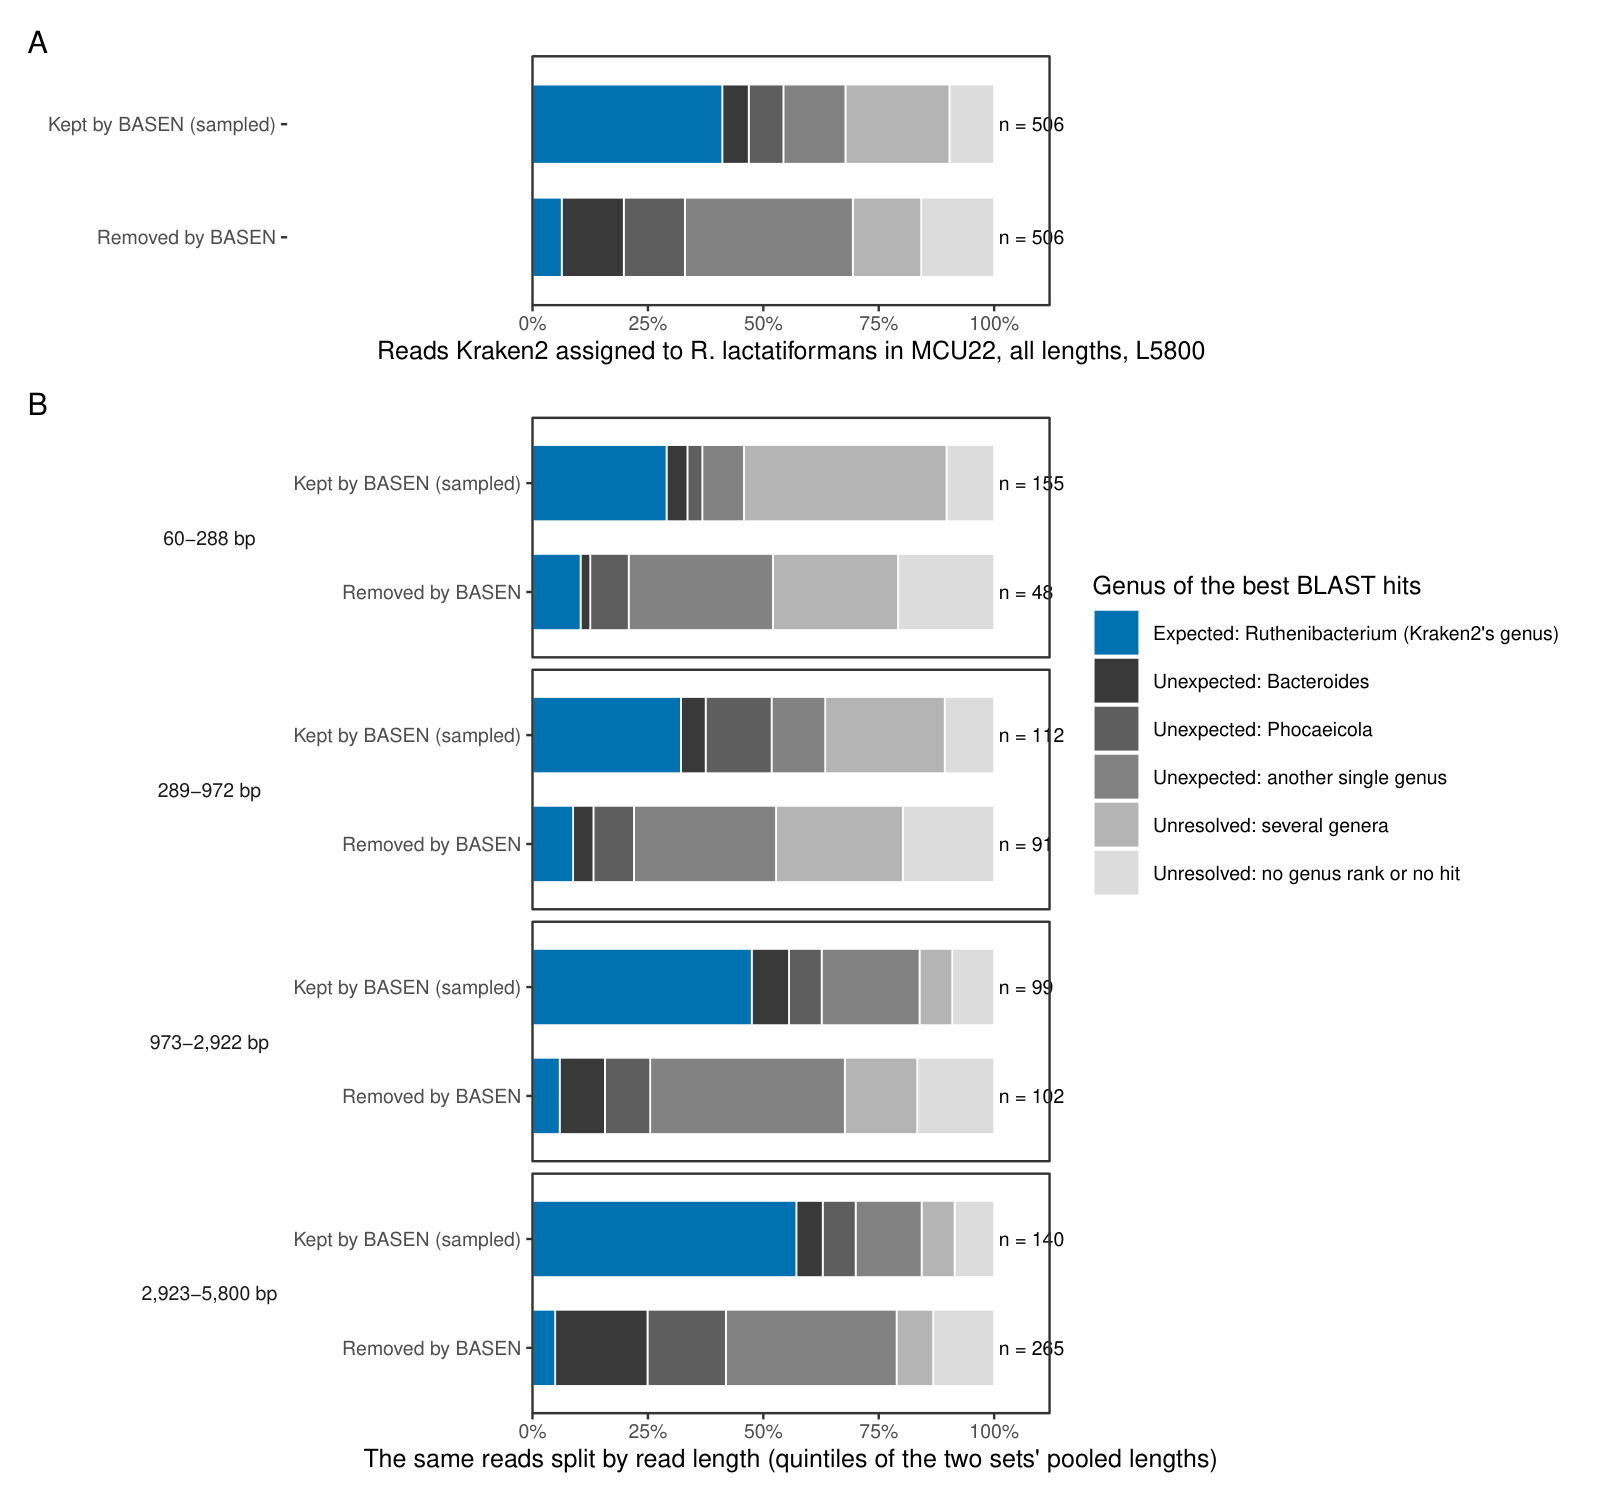
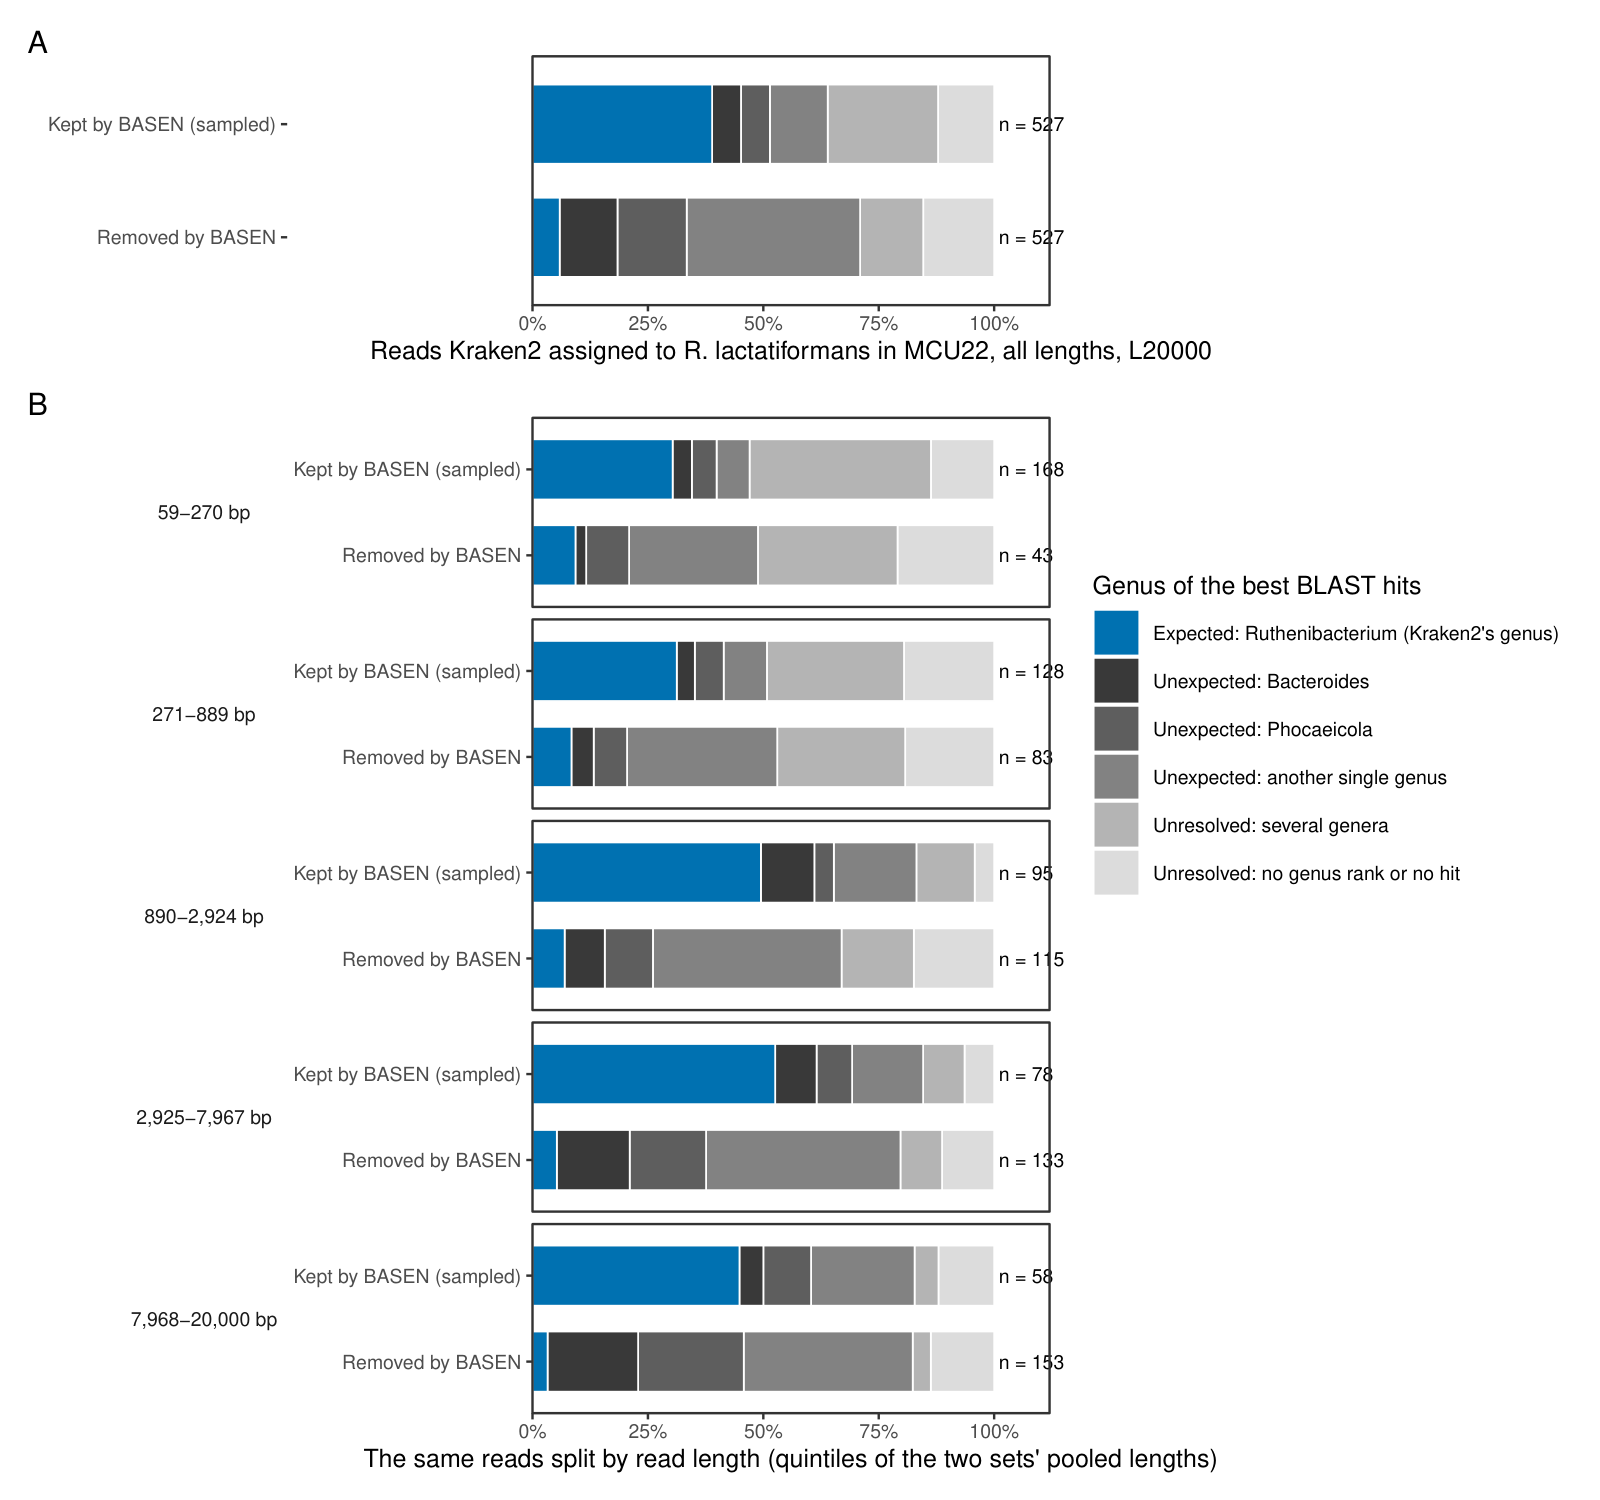
Takeaway: In MCU22, BASEN removed 12.2% of the reads assigned by Kraken2 to R. lactatiformans; BLAST placed 6% of these reads in Ruthenibacterium (reads retained by BASEN: 41%), with lower agreement among removed reads in every length bin.
| Patient | reads removed by BASEN | Removed by BASEN: in the Kraken2 genus | Retained by BASEN (sampled): in the Kraken2 genus | gap (points) | 95% CI |
|---|---|---|---|---|---|
| MCU22 | 605 | 19% | 51% | -31.2 | -36.5 to -26.0 |
| MCU15 | 1,650 | 63% | 88% | -25.1 | -28.0 to -22.2 |
| MCU5 | 1,735 | 78% | 97% | -19.4 | -21.5 to -17.2 |
| MCU12 | 1,992 | 67% | 86% | -18.6 | -21.2 to -16.0 |
| MCU13 | 30 | 13% | 47% | -33.3 | -58.3 to -8.4 |
blast_donor_top3_gap.tsv.
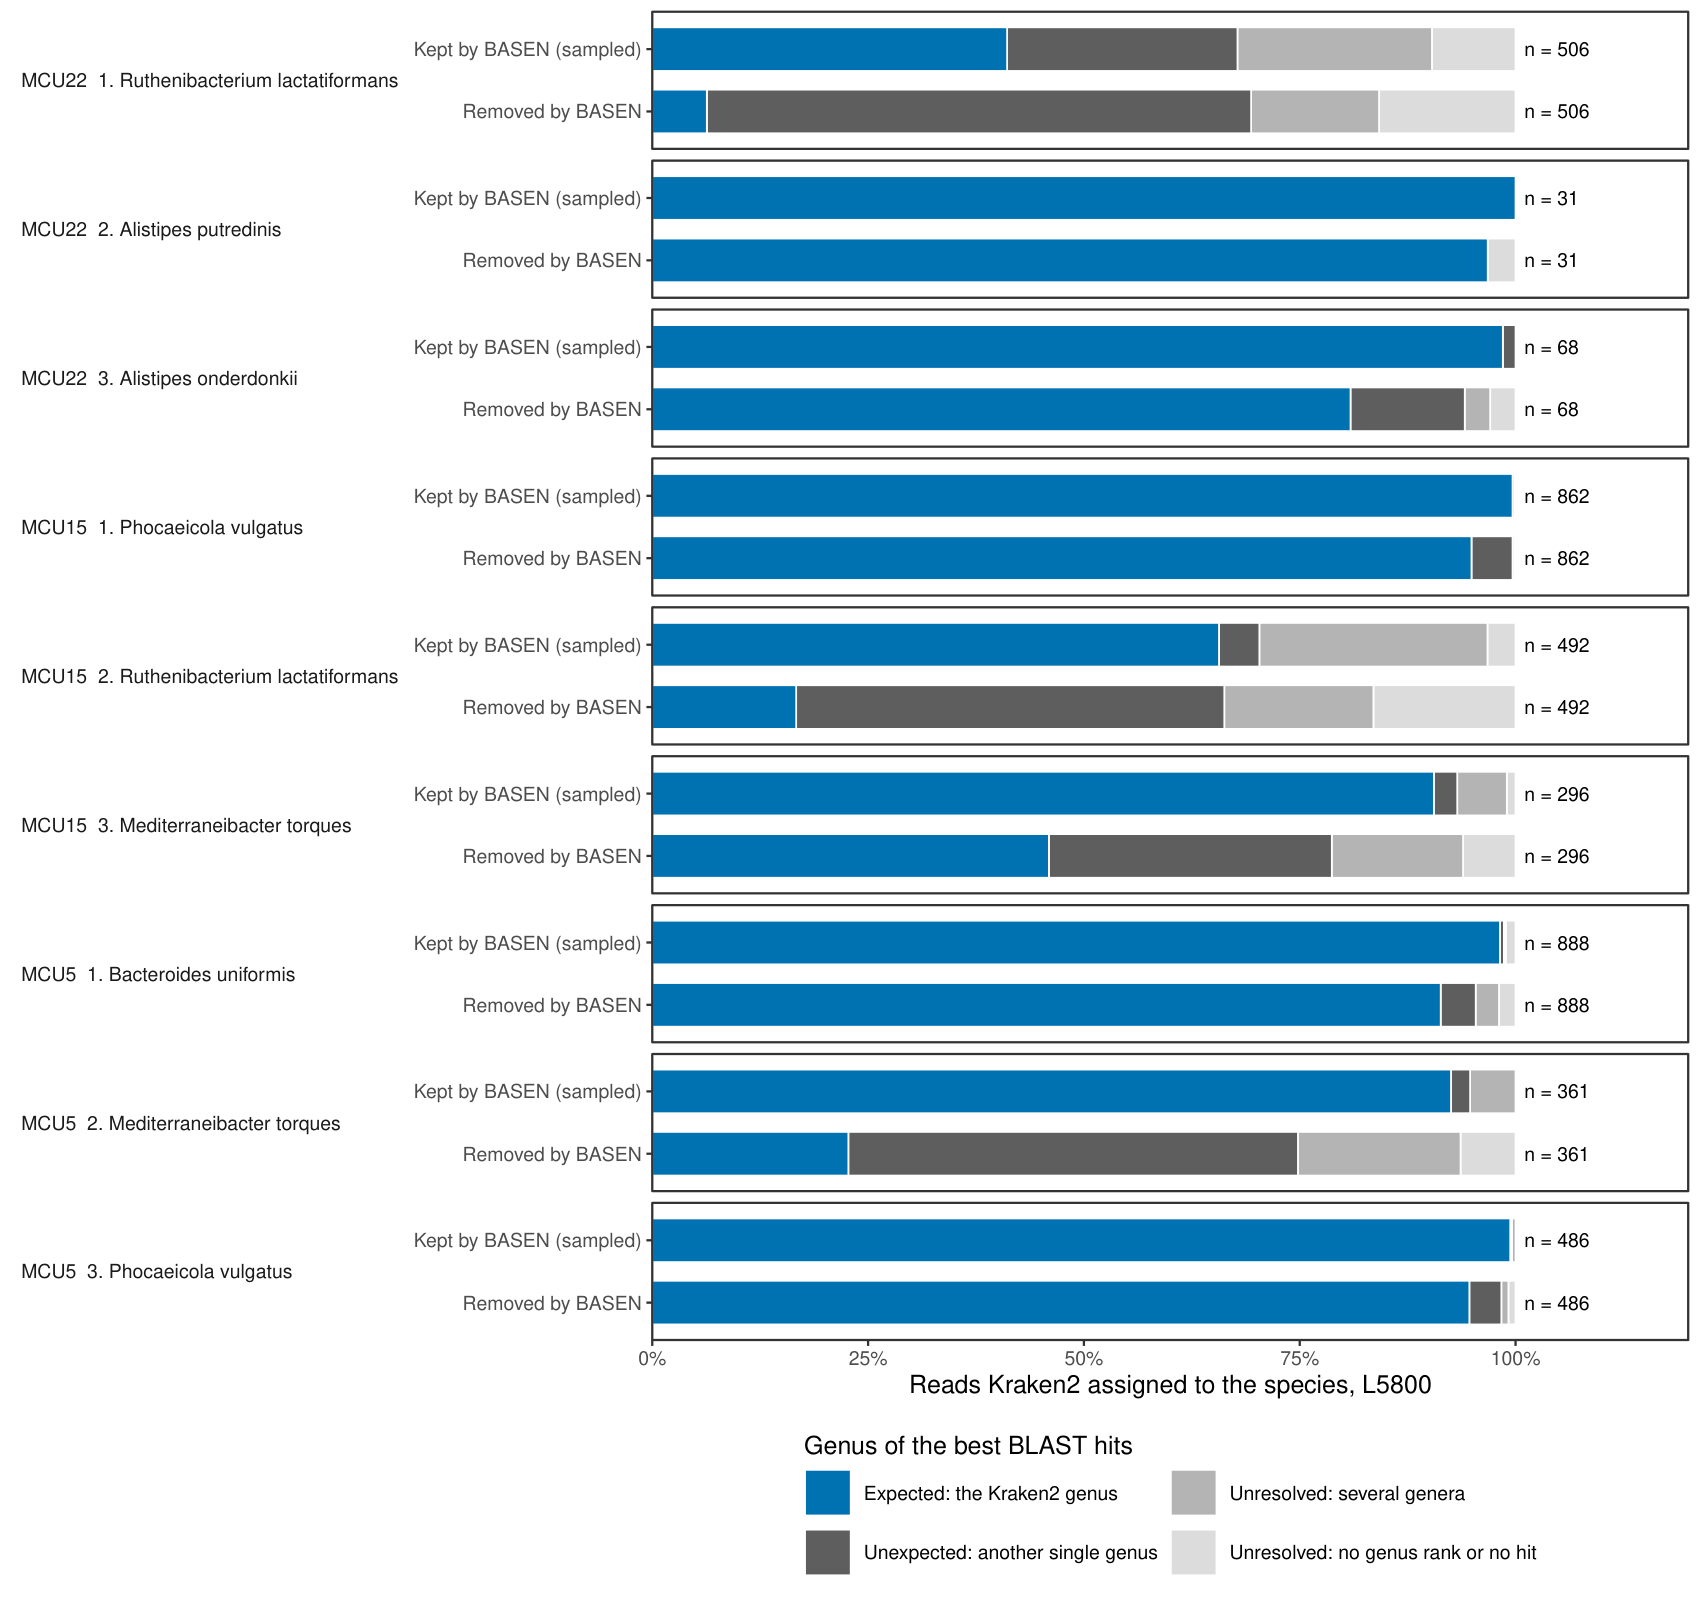
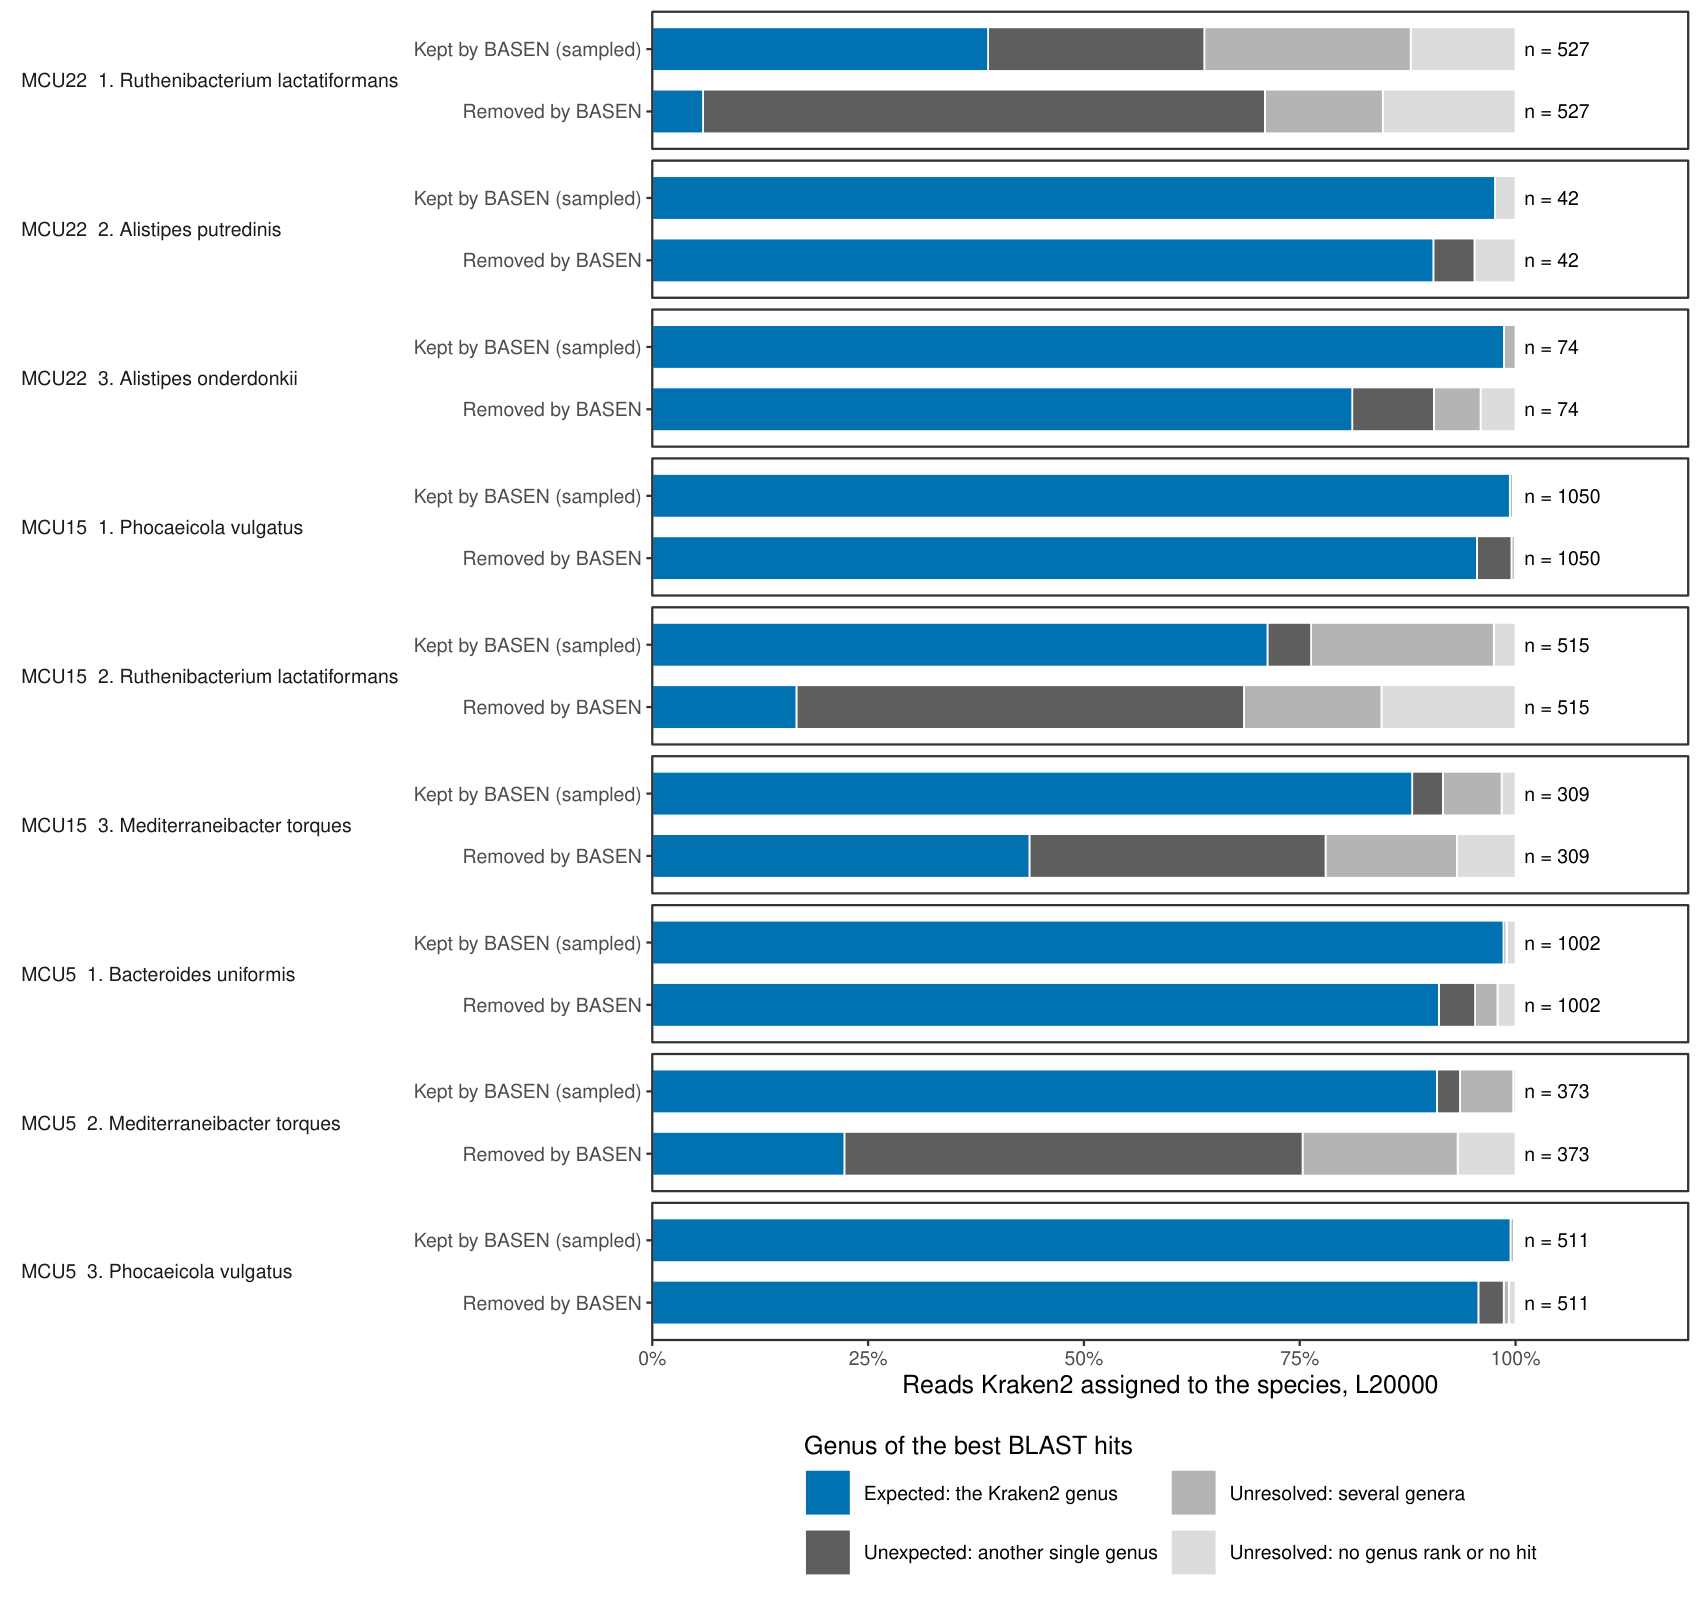
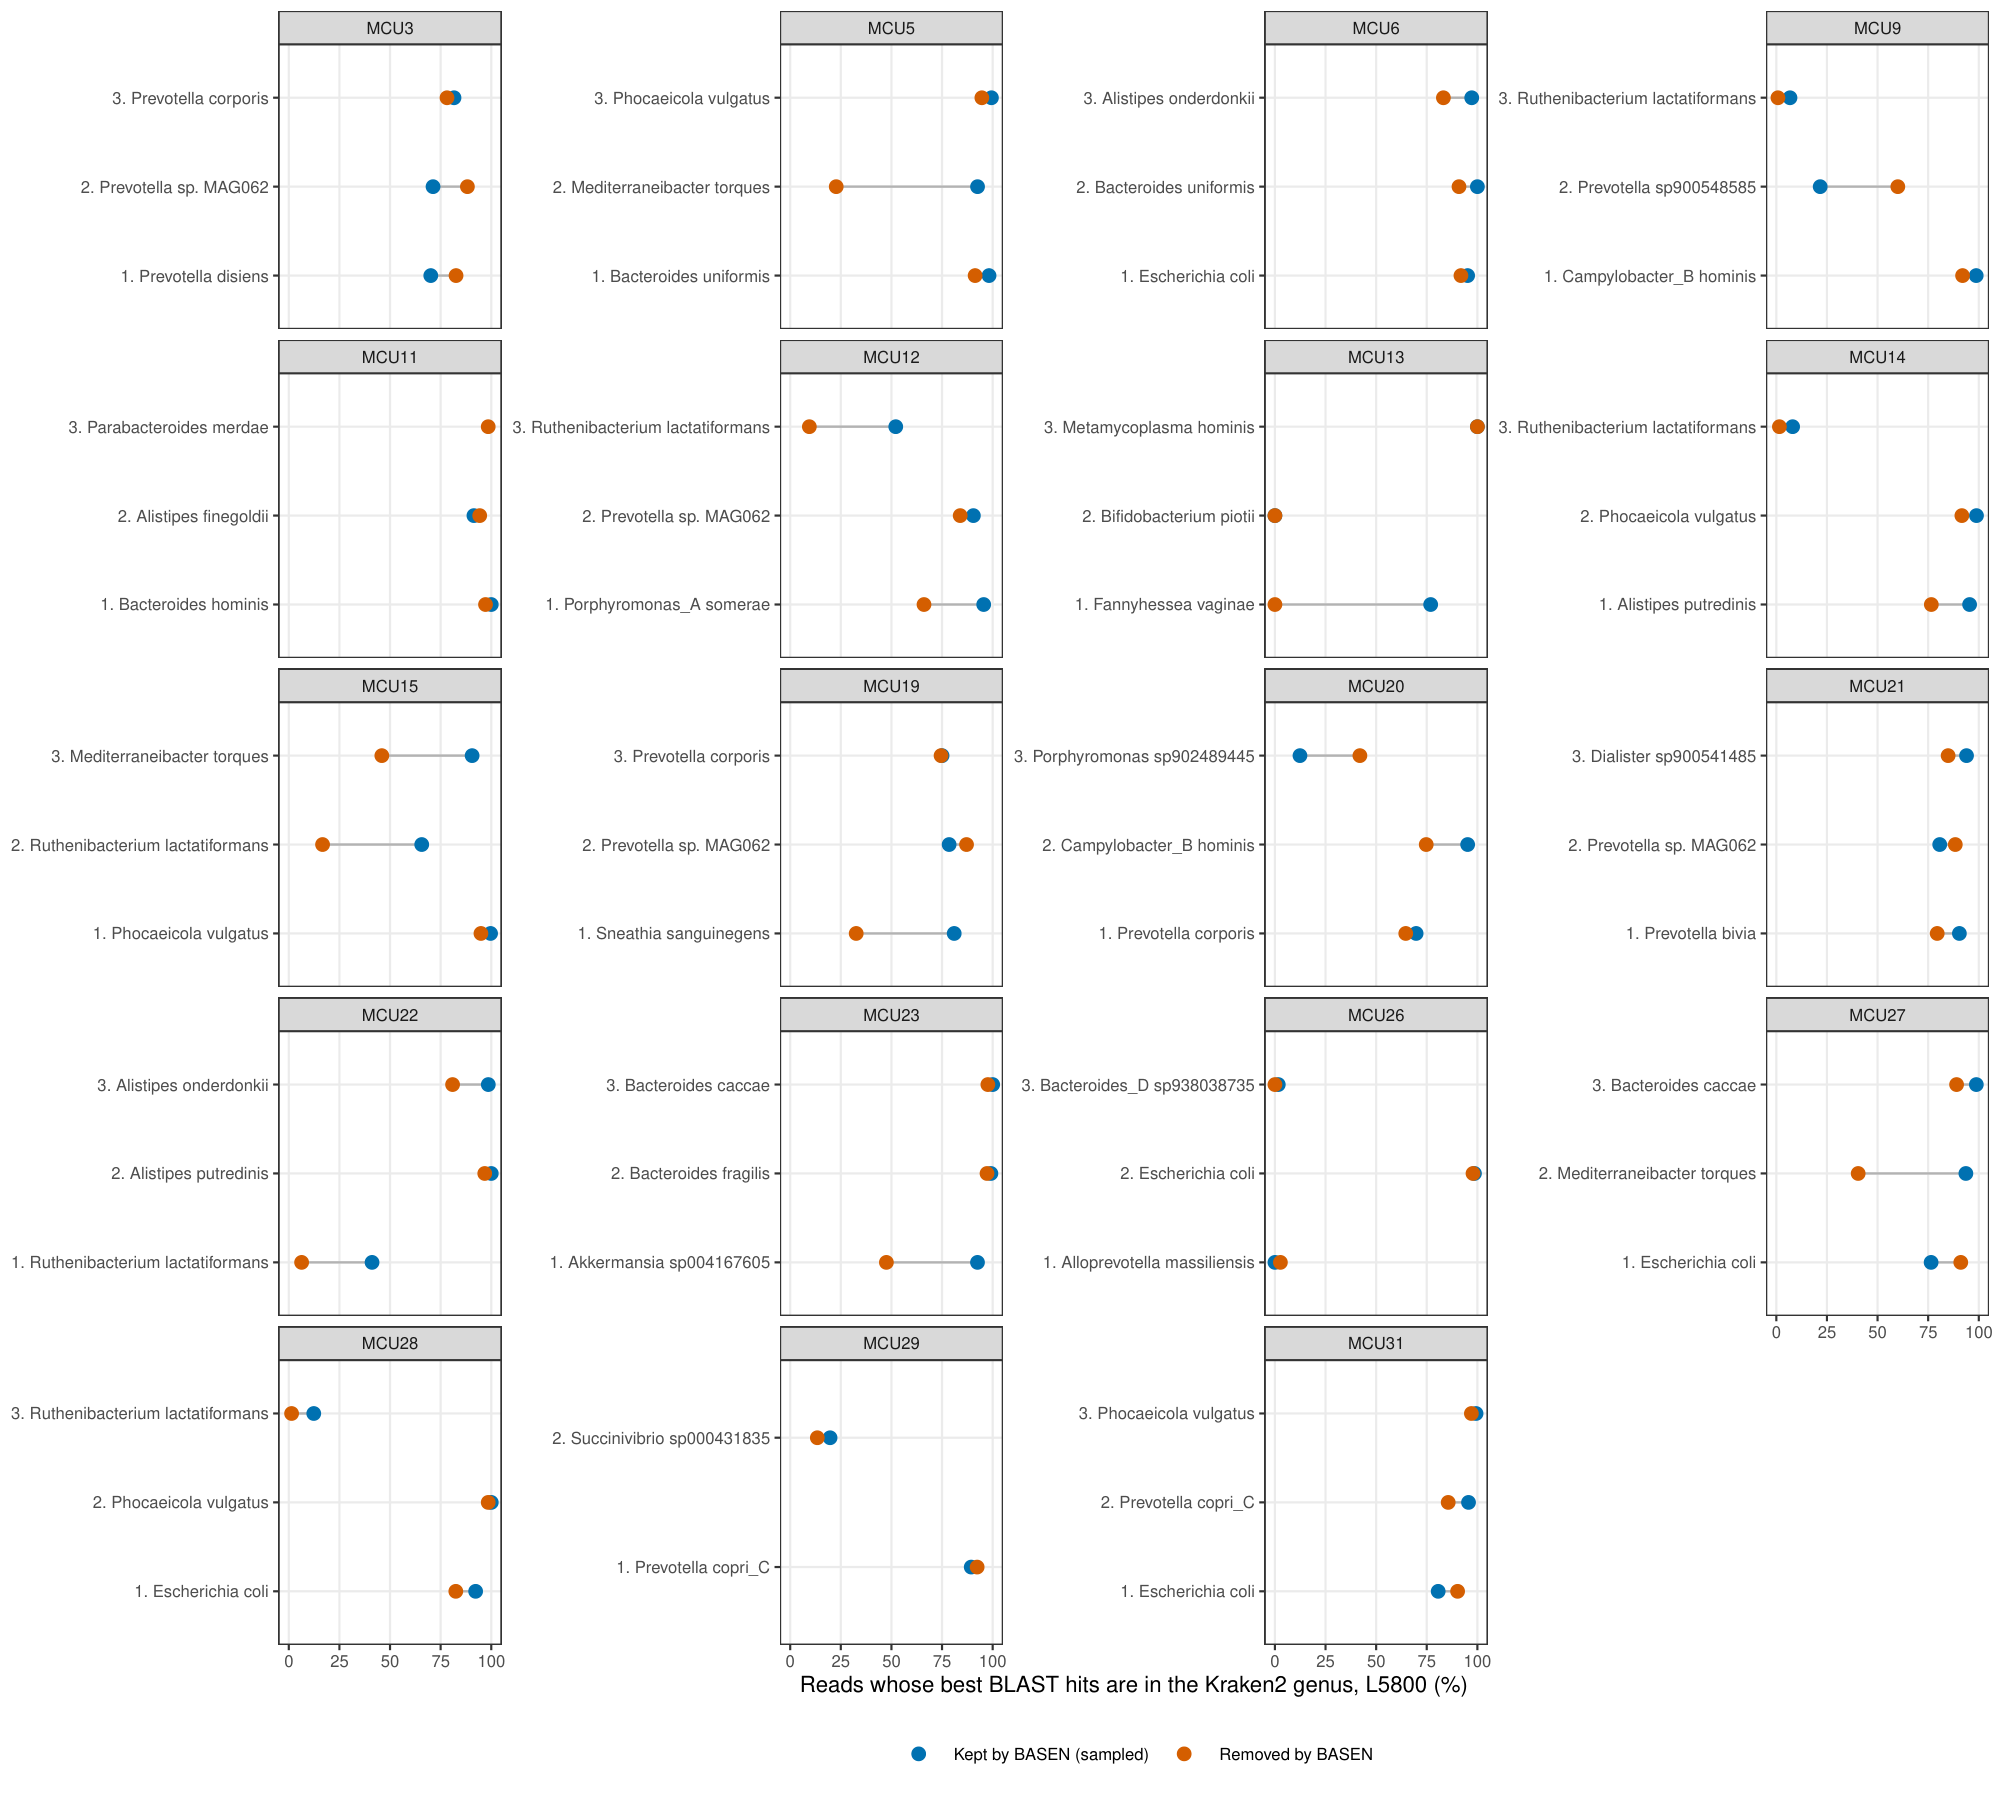
Supplementary analysis: Within patients, filtered reads from species with large abundance differences frequently showed BLAST assignments to other genera: in MCU22, MCU15 and MCU5 only 6–46% of the removed R. lactatiformans and M. torques reads hit the Kraken2 genus, against 41–93% of the retained reads.
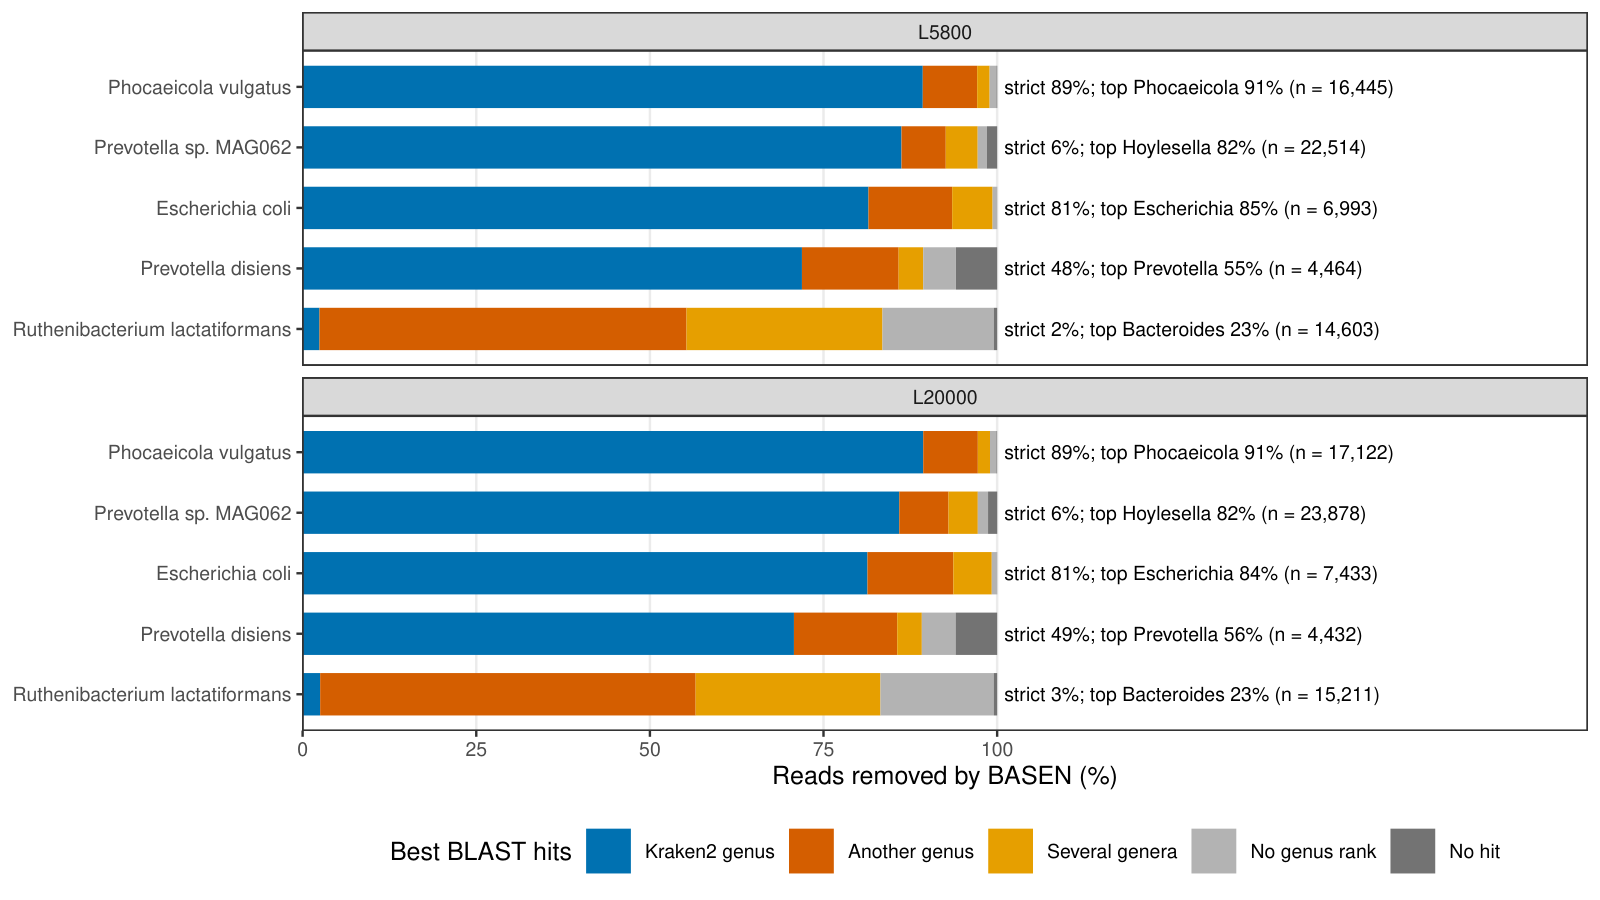
Bars: call of each removed read from its highest-scoring reported BLAST hits (Kraken2 genus, another genus, several genera, no genus rank, no hit). Beside each bar: strict-name agreement, the top BLAST genus and the number of reads.
| Kraken2 taxon | L5800 | L20000 | ||||||||
|---|---|---|---|---|---|---|---|---|---|---|
| removed reads | genus | strict | species | top BLAST genus | removed reads | genus | strict | species | top BLAST genus | |
| Phocaeicola vulgatus | 16,445 | 89% | 89% | 35% | Phocaeicola 91% | 17,122 | 89% | 89% | 36% | Phocaeicola 91% |
| Prevotella sp. MAG062 | 22,514 | 86% | 6% | – | Hoylesella 82% | 23,878 | 86% | 6% | – | Hoylesella 82% |
| Escherichia coli | 6,993 | 81% | 81% | 81% | Escherichia 85% | 7,433 | 81% | 81% | 81% | Escherichia 84% |
| Prevotella disiens | 4,464 | 72% | 48% | 0% | Prevotella 55% | 4,432 | 71% | 49% | 0% | Prevotella 56% |
| Ruthenibacterium lactatiformans | 14,603 | 2% | 2% | 2% | Bacteroides 23% | 15,211 | 3% | 3% | 2% | Bacteroides 23% |
Takeaway: For four of the five cohort taxa, most filtered reads showed concordant genus assignments, although species-level agreement was lower; R. lactatiformans was the exception, with filtered reads predominantly matching other genera.
| Kraken2 taxon (L5800) | Genus | Species | ||||||
|---|---|---|---|---|---|---|---|---|
| removed / retained (sampled) by BASEN | among hits | adj. OR (95% CI) | samples removed lower | removed / retained (sampled) by BASEN | among hits | adj. OR (95% CI) | samples removed lower | |
| Ruthenibacterium lactatiformans | 2% / 18% | 2% / 18% | 0.07 (0.06–0.07) | 17 of 19 | 2% / 17% | 2% / 18% | 0.06 (0.06–0.07) | 17 of 19 |
| Phocaeicola vulgatus | 89% / 99% | 89% / 99% | 0.08 (0.07–0.10) | 19 of 19 | 35% / 67% | 35% / 67% | 0.21 (0.20–0.22) | 19 of 19 |
| Prevotella sp. MAG062 | 86% / 94% | 88% / 97% | 0.38 (0.35–0.41) | 9 of 17 | – | – | – | – |
| Escherichia coli | 81% / 87% | 81% / 87% | 0.40 (0.36–0.45) | 14 of 18 | 81% / 86% | 81% / 86% | 0.42 (0.38–0.46) | 13 of 18 |
| Prevotella disiens | 72% / 48% | 76% / 84% | 2.01 (1.77–2.27) | 2 of 18 | 0% / 0% | 0% / 0% | 2.51 (0.90–6.98) | 1 of 18 |
blast_removed_vs_kept.tsv.
Takeaway: Filtered reads showed lower BLAST agreement with Kraken2 assignments than retained reads for four of five taxa at genus level and three of four at species level after adjustment for read length and sample. This supports enrichment for likely false-positive assignments among filtered reads, although most filtered reads still agreed at genus level for four of the five taxa.
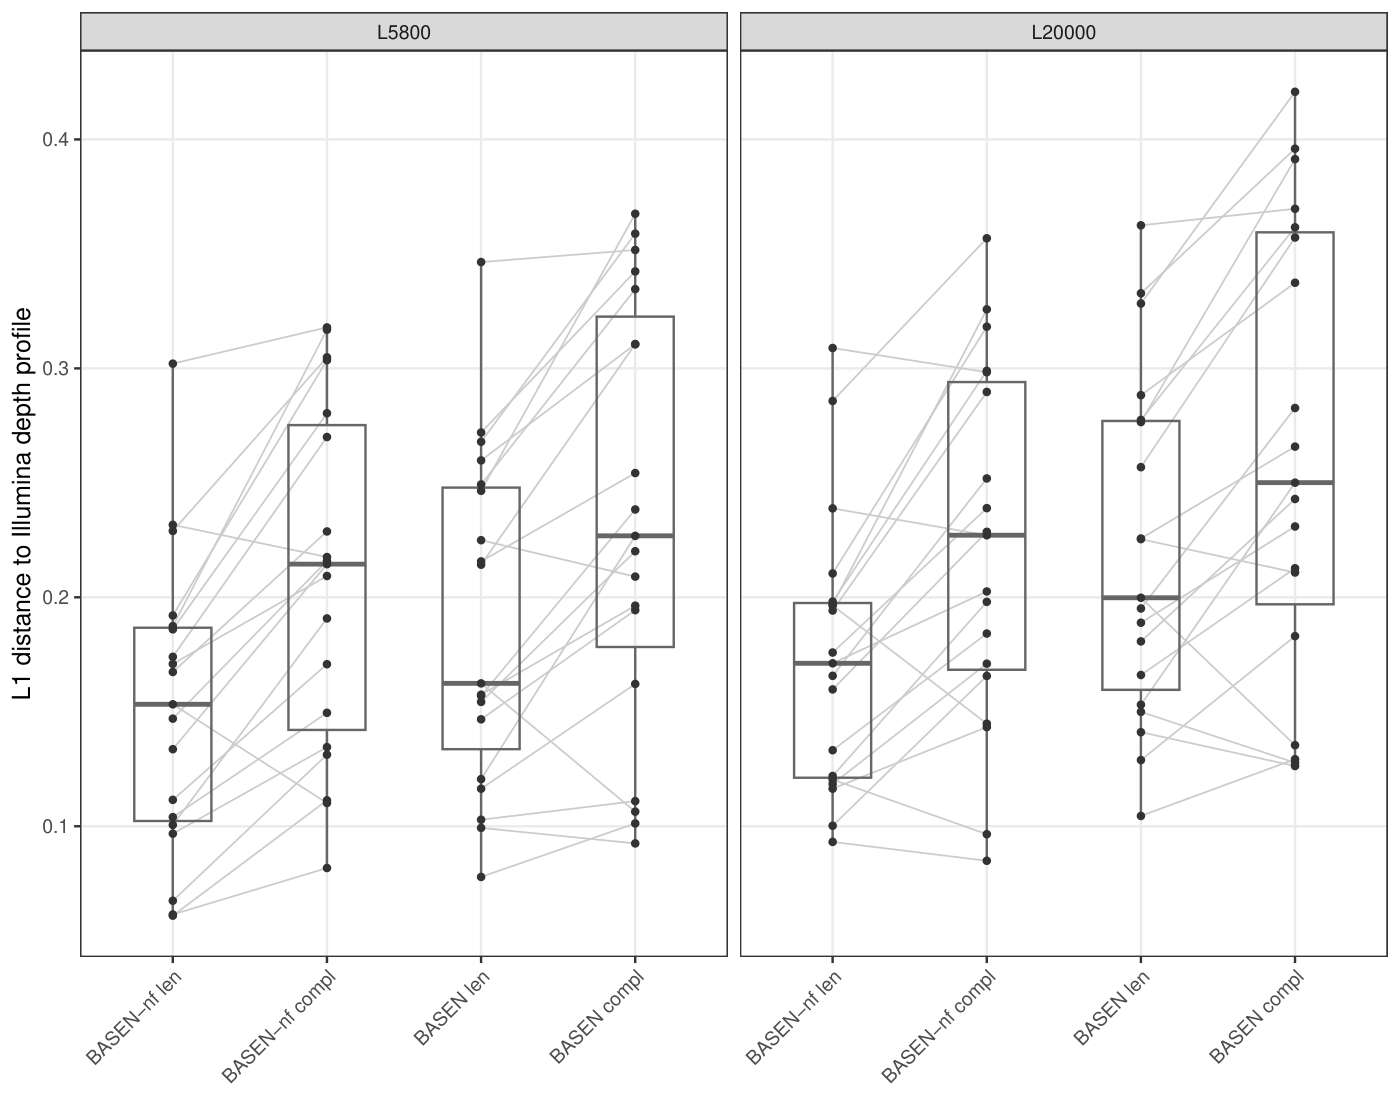
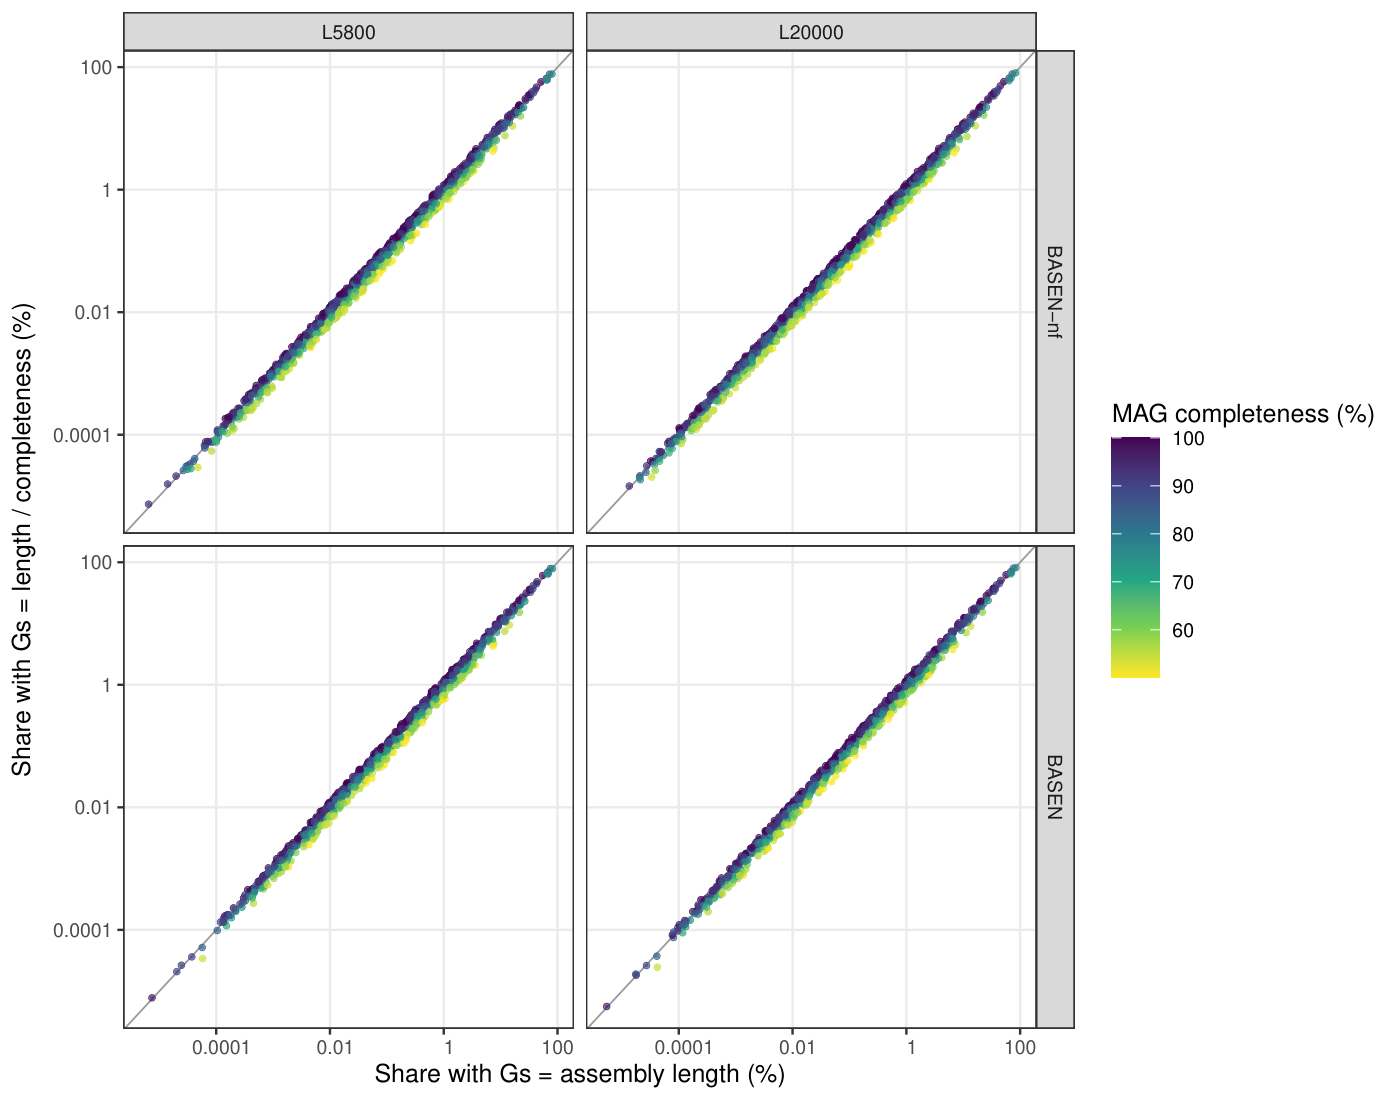
Supplementary analysis: Using MAG assembly length yielded closer agreement with the Illumina depth profile than dividing assembly length by estimated completeness. Both measures were calculated over the same assemblies, limiting independent validation.
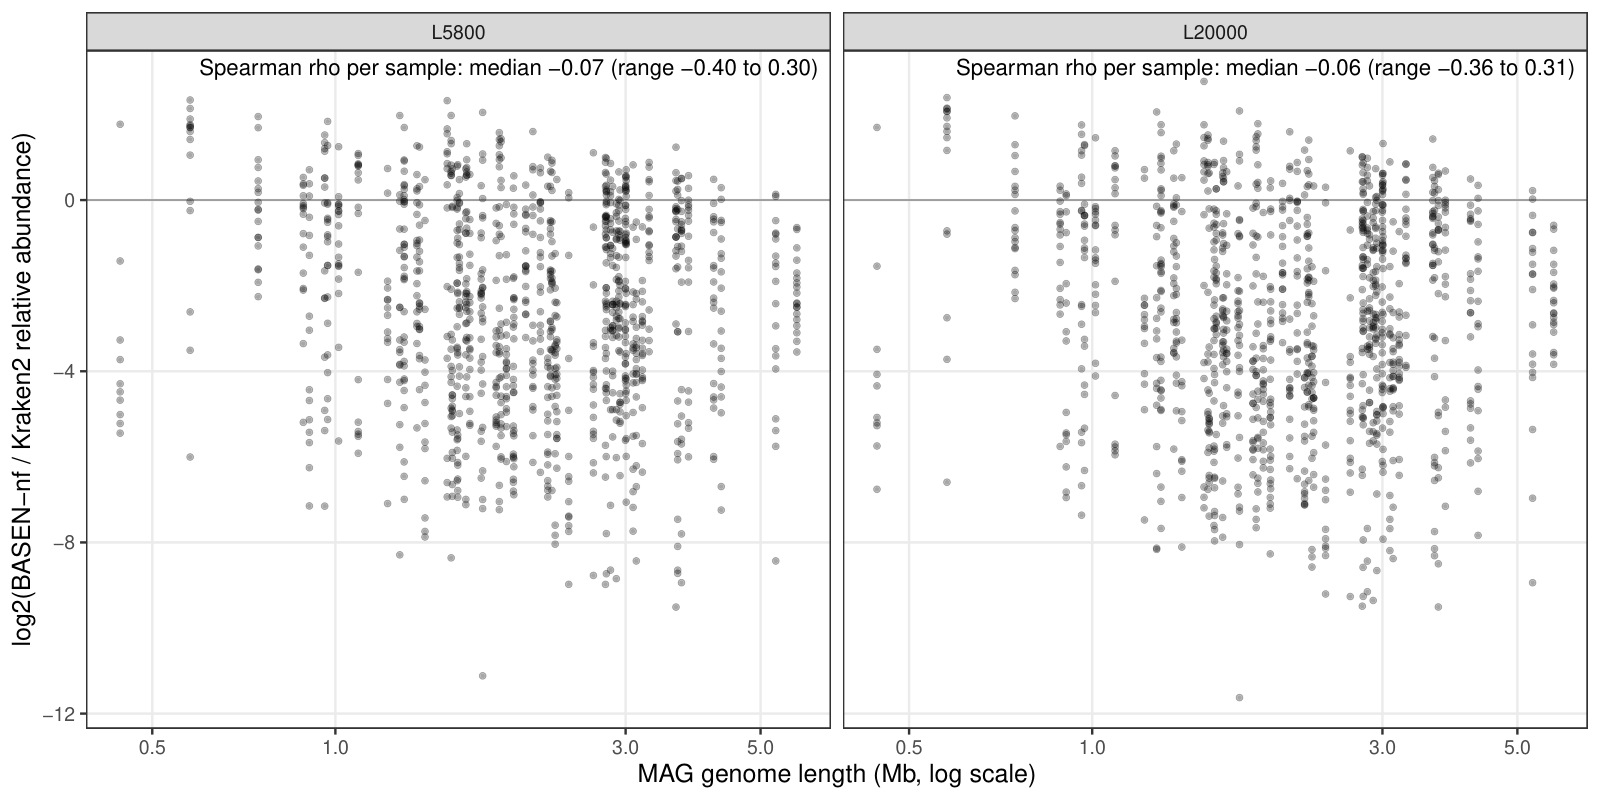
One point per species and sample; each vertical stripe is one MAG across samples. Spearman rho per sample in each panel.
Supplementary analysis: Variation in assigned evidence per read predominated over the 13-fold genome-size range in these samples, whereas the Microbial standard showed a clear genome-size effect over a 12-fold range.
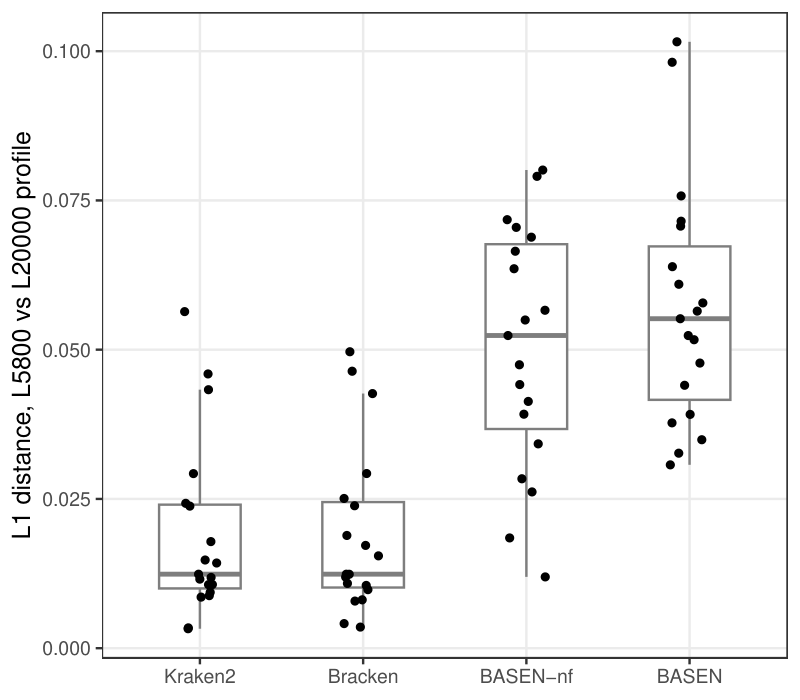
One point per sample: L1 between the sample's L5800 and L20000 profiles for each method.
Supplementary analysis: BASEN estimates were more sensitive to the read-length cut-off than read-count estimates. Cut-offs should be reported and applied consistently across samples.
3. Summary of findings
- Genome-copy agreement: Against an Illumina-derived genome-copy reference (Illumina read depth over the same 66 MAGs), BASEN-nf and BASEN were closer than Kraken2 in every one of the 19 samples at both cut-offs, with less than half its L1 distance (medians 0.153 and 0.162 vs 0.416 at L5800). Bracken showed a smaller reduction in median L1 than either BASEN variant.
- Limited abundance shifts after filtering: The filter removed a substantial fraction of classified reads while producing limited changes in relative abundance (MCU22 R. lactatiformans: −12.2% of its reads, share 20.5% to 21.1%; 97% of species shares change by 1 percentage point or less).
- Taxonomic support for filtered reads: BLAST agreement with the Kraken2 genus was lower for filtered reads than for retained reads in most evaluated taxa.
- Cohort, five most-shifted species: removed reads agree less in 4 of 5 at genus level (the fifth, P. disiens, showed the reverse pattern because its short retained reads often had no BLAST hit) and 3 of 4 at species level (the fourth, P. disiens, matched its NCBI species in under 1% of reads in either set), after adjusting for read length and sample.
- Single patient: in MCU22, 6% of the removed R. lactatiformans reads hit Ruthenibacterium vs 41% of the retained reads (Fisher's exact p-value = 1.5 × 10-41), across the evaluated length bins.
- Per patient, each patient's three most-shifted species: removed reads agree less in 42 of 55 pairs; the largest gaps are R. lactatiformans and M. torques (MCU22, MCU15, MCU5).
- Most filtered reads retained genus-level agreement, frequently matching related species; filtering therefore enriched for likely misassignments without exclusively removing such reads.
- Interpretive boundary: These human data do not establish that filtering improves abundance accuracy. Filtering increased the distance to the Illumina reference (BASEN further than BASEN-nf in 18 of 19 samples); the mock-community mixtures provide evidence of its benefit in the presence of absent taxa, whereas the human data show limited changes in abundance estimates.
- Supplementary genome-length analysis: Using the MAG assembly length yielded closer agreement with Illumina depth; dividing by CheckM2 completeness moved it further from the Illumina reference.
- Supplementary sensitivity analyses: Differences in assigned evidence per read contributed more strongly to abundance shifts than genome length. BASEN profiles were more sensitive to the read-length cut-off than read-count profiles.
4. Limitations
- No ground truth. The Illumina depth profile is a comparative reference rather than a ground truth: Illumina has its own biases (e.g. GC content, library preparation); the MAGs were binned from these same Illumina reads; and only 30–64% of each sample's Illumina reads map to the 66 MAGs, so the profiles are relative to the MAGs, not to the whole community.
- One database, species level. One set of 66 MAGs (CPU binning, one per species); reads from taxa without a MAG are either unclassified or assigned to a relative.
- Read-length cut-off. BASEN counts bases, so its profiles move between the 5,800 and 20,000 bp trims about four to five times as much as read counts (median L1 0.055 vs 0.012). The cut-off must be reported and applied consistently for samples that are compared.
- Filter thresholds. 0.75 / 0.75 were chosen for these samples by inspecting the per-read distributions, not by the threshold grid used for the standards (no ground truth was available for equivalent optimization in these samples).