
Dorado Run Analyzer (Doradora)
Heewon Seo
1 Introduction
The Bioinformatics Hub generated this report includes stats and diagnostic plots of the Oxford Nanopore Sequencing data.
An analytical platform designed to quantify and compare Nanopore sequencing data quality across multiple experimental conditions, enabling detection of batch-specific variability and ensuring consistency in sequencing performance.
2 Prerequisite
2.1 Environment
- OS: macOS 26.7.1
- Platform: aarch64-apple-darwin20
- Software: R (v4.5.1)
- Pakcages: dplyr (v1.1.4), ggplot2 (v4.0.1), ggrepel (v0.9.6), ggridges (v0.5.7), ggsankey (v0.0.99999), stringr (v1.6.0), reshape2 (v1.4.5), RColorBrewer (v1.1-3), viridis (v0.6.5), cowplot (v1.2.0), data.table (v1.18.0)
2.2 Metadata
- Names used in this report (runs are named Name-01 to Name-06):
- Microbial: ZymoBIOMICS Microbial Community Standard (D6300)
- Gut: ZymoBIOMICS Gut Microbiome Standard (D6331)
- Oral: ZymoBIOMICS Oral Microbiome Standard (D6332)
2.3 Run report
- MinKNOW automatically generates a run report containing summary statistics, configuration details, output metrics, and alignment information to help users evaluate sequencing data quality.
- Source: https://nanoporetech.com/document/experiment-companion-minknow#run-report
- Reports (one per run; failed: MinKNOW did not write a report):
| Data | Run 01 | Run 02 | Run 03 | Run 04 | Run 05 | Run 06 |
|---|---|---|---|---|---|---|
| Microbial | Microbial-01 | Microbial-02 | Microbial-03 | failed | Microbial-05 | Microbial-06 |
| Gut | Gut-01 | Gut-02 | Gut-03 | Gut-04 | Gut-05 | Gut-06 |
| Oral | Oral-01 | Oral-02 | Oral-03 | Oral-04 | Oral-05 | Oral-06 |
3 Quality assessment
3.1 Preparation
- Set working directory
# Do not run
baseDir <- "WORKING_DIRECTORY" # where the Nanopore stats files are located
setwd(baseDir)
outDir <- file.path(baseDir, "Results")# Load libraries
library(dplyr)
library(ggplot2)
library(ggrepel)
library(ggridges)
library(ggsankey)
library(stringr)
library(reshape2)
library(RColorBrewer)
library(viridis)
library(cowplot)3.2 Sequence summary
- Sequencing output summary files were generated using Dorado with the summary command.
- Dorado basecalled without a quality-score filter
(
--min-qscorenot set), so the summaries hold every read, barcoded or not. - 18 runs, one MinKNOW run each: Microbial-01 to -06 and Gut-01 to -06 (Flongle, one flow cell per run, SQK-RBK114-24) and Oral-01 to -06 (six runs on one flow cell, FBG46173, SQK-RBK114-96).
- Pore activity files could not be regenerated when MinKNOW failed and only the available files were included.
3.2.1 Import data
tsvFiles <- list.files(path = file.path(baseDir, "Data"), pattern = "tsv", full.names = TRUE)
# remove
# remove
# remove
if (file.exists(file.path(outDir, "summaryL.RDS"))) { summaryL <- readRDS(file.path(outDir, "summaryL.RDS")); summary <- readRDS(file.path(outDir, "summary.RDS")) } else { # remove
# remove
# remove
# remove
# sequencing summary
summaryL <- lapply(seq_along(tsvFiles), function(idx) {
tsvFile <- tsvFiles[idx]
tsv <- as.data.frame(data.table::fread(tsvFile, sep = "\t", header = TRUE))
tsv$sample <- gsub(".tsv.gz", "", basename(tsvFile))
return(tsv)
})
names(summaryL) <- gsub(".tsv.gz", "", basename(tsvFiles))
summaryL <- summaryL[sampleNames] # reorder
summary <- do.call(rbind, summaryL)
summary$sample <- factor(summary$sample, levels = sampleNames)
# remove
# remove
# remove
saveRDS(summaryL, file.path(outDir, "summaryL.RDS")); saveRDS(summary, file.path(outDir, "summary.RDS")) } # remove
# remove
# remove
# remove
# pore activity
csvFiles <- list.files(path = file.path(baseDir, "Data"), pattern = "csv", full.names = TRUE)
poreL <- lapply(seq_along(csvFiles), function(idx) {
csvFile <- csvFiles[idx]
csv <- read.csv(csvFile, header = TRUE)
csv$sample <- gsub(".csv", "", basename(csvFile))
return(csv)
})
names(poreL) <- gsub(".csv", "", basename(csvFiles))
poreRun <- list() # one MinKNOW run per plate
basename(tsvFiles)## [1] "Gut-01.tsv.gz" "Gut-02.tsv.gz" "Gut-03.tsv.gz"
## [4] "Gut-04.tsv.gz" "Gut-05.tsv.gz" "Gut-06.tsv.gz"
## [7] "Microbial-01.tsv.gz" "Microbial-02.tsv.gz" "Microbial-03.tsv.gz"
## [10] "Microbial-04.tsv.gz" "Microbial-05.tsv.gz" "Microbial-06.tsv.gz"
## [13] "Oral-01.tsv.gz" "Oral-02.tsv.gz" "Oral-03.tsv.gz"
## [16] "Oral-04.tsv.gz" "Oral-05.tsv.gz" "Oral-06.tsv.gz"3.2.2 Sequence output
- Legend:
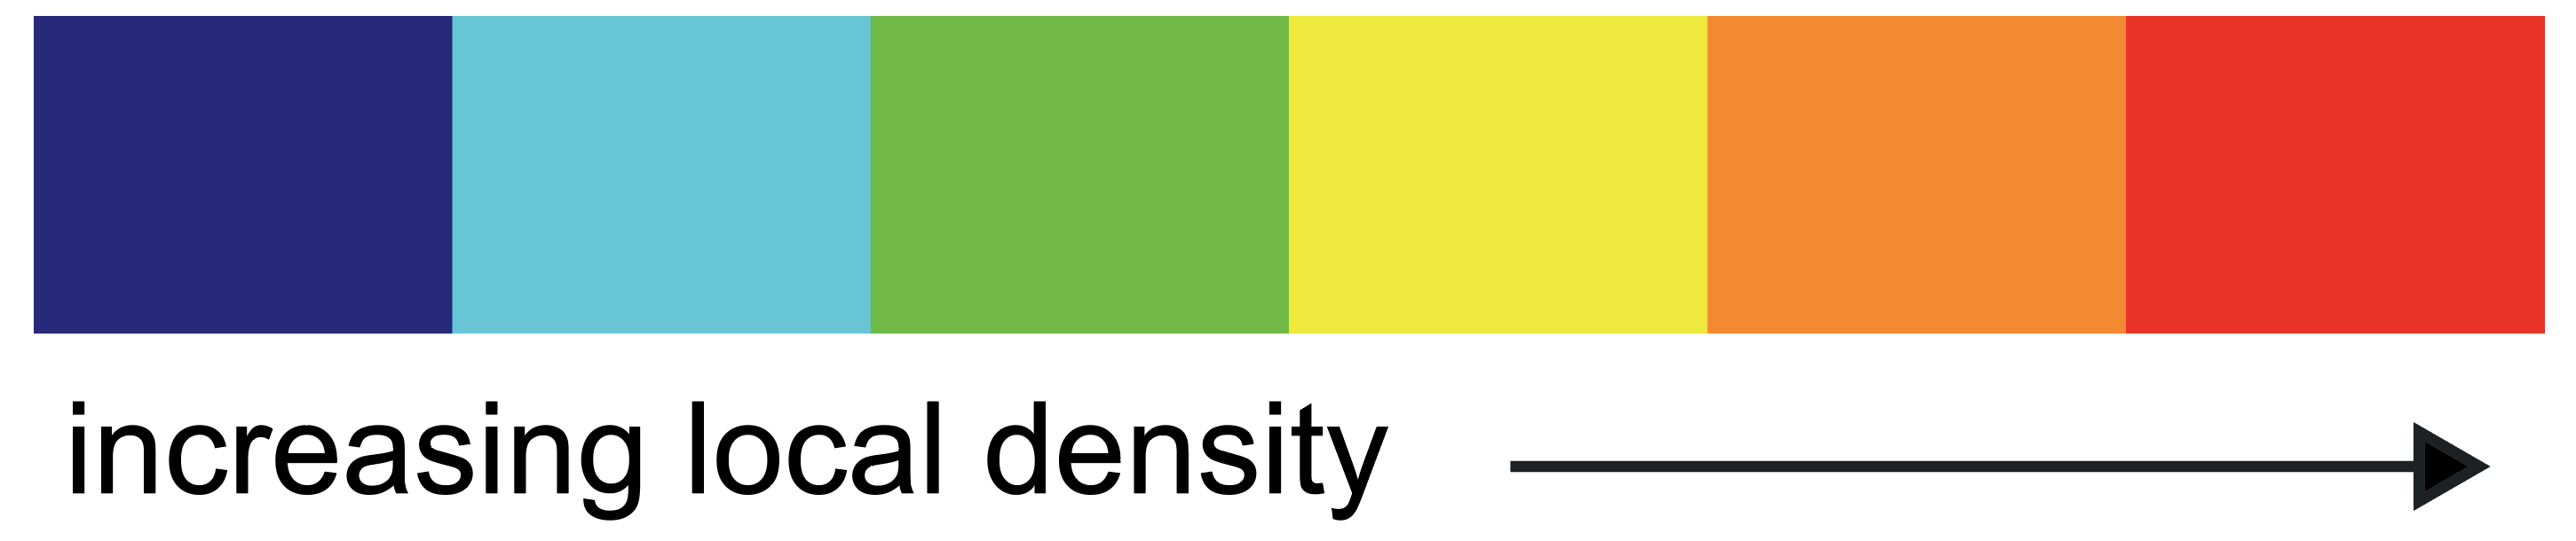
readLengthMax <- max(summary$sequence_length_template)
readQualityMax <- max(summary$mean_qscore_template)
for (sampleName in sampleNames) {
stat <- summaryL[[sampleName]]
readDf <- data.frame(
readLength = stat$sequence_length_template,
readQuality = stat$mean_qscore_template
)
readDf <- densityColors(df = readDf, cols = heatCols)
cat("#### ", sampleName, "\n")
cat("\n")
cat(" * Number of reads: ", format(nrow(readDf), big.mark=",",scientific = FALSE), "\n")
plot(log10(readDf$readLength), readDf$readQuality, col = readDf$Col, xlab = "Length, log10", ylab = "Quality, phred", pch = 20, xlim = c(0, log10(readLengthMax)), ylim = c(0, readQualityMax))
cat("\n\n")
}3.2.2.1 Microbial-01
- Number of reads: 3,563

3.2.2.2 Microbial-02
- Number of reads: 976

3.2.2.3 Microbial-03
- Number of reads: 8,373

3.2.2.4 Microbial-04
- Number of reads: 11,410

3.2.2.5 Microbial-05
- Number of reads: 1,511

3.2.2.6 Microbial-06
- Number of reads: 68,036

3.2.2.7 Gut-01
- Number of reads: 12,199

3.2.2.8 Gut-02
- Number of reads: 4,338

3.2.2.9 Gut-03
- Number of reads: 4,468

3.2.2.10 Gut-04
- Number of reads: 10,402

3.2.2.11 Gut-05
- Number of reads: 36,657

3.2.2.12 Gut-06
- Number of reads: 29,725

3.2.2.13 Oral-01
- Number of reads: 300,749

3.2.2.14 Oral-02
- Number of reads: 239,432

3.2.2.15 Oral-03
- Number of reads: 199,813

3.2.2.16 Oral-04
- Number of reads: 172,524

3.2.2.17 Oral-05
- Number of reads: 61,054

3.2.2.18 Oral-06
- Number of reads: 79,751

3.2.3 Read quality
- Read lengths were log10-transformed according to the formula log10(read length + 1)
| Min. | 1st Qu. | Median | Mean | 3rd Qu. | Max. | |
|---|---|---|---|---|---|---|
| Microbial-01 | 1.00 | 4.30 | 10.94 | 11.38 | 17.03 | 39.60 |
| Microbial-02 | 1.04 | 11.05 | 16.75 | 15.85 | 20.91 | 34.34 |
| Microbial-03 | 1.00 | 8.32 | 14.38 | 13.65 | 18.60 | 41.41 |
| Microbial-04 | 1.00 | 6.31 | 12.86 | 12.67 | 18.32 | 41.52 |
| Microbial-05 | 1.00 | 2.18 | 3.80 | 7.82 | 13.64 | 43.44 |
| Microbial-06 | 1.00 | 12.90 | 16.56 | 15.79 | 19.21 | 41.74 |
| Gut-01 | 1.00 | 8.79 | 14.01 | 13.27 | 17.40 | 37.64 |
| Gut-02 | 1.00 | 8.86 | 13.81 | 13.09 | 17.40 | 40.47 |
| Gut-03 | 1.00 | 5.45 | 11.79 | 11.74 | 16.99 | 36.50 |
| Gut-04 | 1.00 | 5.15 | 13.06 | 11.99 | 17.57 | 37.59 |
| Gut-05 | 1.00 | 13.49 | 16.97 | 16.19 | 19.75 | 42.49 |
| Gut-06 | 1.00 | 8.71 | 14.36 | 13.27 | 17.70 | 41.36 |
| Oral-01 | 1.00 | 16.10 | 21.16 | 19.86 | 24.64 | 47.80 |
| Oral-02 | 1.00 | 14.24 | 19.82 | 18.73 | 23.89 | 48.41 |
| Oral-03 | 1.00 | 13.04 | 18.94 | 18.04 | 23.48 | 48.36 |
| Oral-04 | 1.00 | 13.23 | 19.12 | 18.22 | 23.53 | 47.02 |
| Oral-05 | 1.00 | 15.48 | 20.39 | 19.49 | 24.19 | 44.27 |
| Oral-06 | 1.00 | 13.99 | 19.61 | 18.61 | 23.75 | 47.83 |
# remove
# remove
# remove
if (file.exists(file.path(outDir, "ridgeQuality.RDS"))) { ridgeQuality <- readRDS(file.path(outDir, "ridgeQuality.RDS")) } else { # remove
# remove
# remove
# remove
ridgeQuality <- ggplot(summary, aes(x = mean_qscore_template, y = factor(sample, levels = rev(sampleNames)), fill = ..x..)) + # first run on top, as in the table
geom_density_ridges_gradient(scale = 3, rel_min_height = 0.01) +
scale_fill_viridis(name = "Quality, phred", option = "C") +
labs(
x = "Quality, phred",
y = "Run"
) +
theme_bw() +
theme(
axis.line = element_line(colour = "black"),
panel.grid.minor = element_blank(),
panel.border = element_blank(),
panel.background = element_blank(),
axis.text.x = element_text(angle = 0, vjust = 0, hjust = 0.5),
text = element_text(size = 12)
) +
geom_vline(xintercept = 20, linetype = "dashed", color = "red", size = 1)
# remove
# remove
# remove
saveRDS(ridgeQuality, file.path(outDir, "ridgeQuality.RDS")) } # remove
# remove
# remove
# remove
print(ridgeQuality)
3.2.4 Read length
| Min. | 1st Qu. | Median | Mean | 3rd Qu. | Max. | |
|---|---|---|---|---|---|---|
| Microbial-01 | 5 | 65.0 | 125.0 | 1,291.88 | 302.50 | 322,891 |
| Microbial-02 | 6 | 80.5 | 207.5 | 1,015.41 | 775.75 | 41,436 |
| Microbial-03 | 6 | 98.0 | 217.0 | 917.40 | 596.00 | 1,178,993 |
| Microbial-04 | 5 | 95.0 | 158.0 | 878.09 | 774.00 | 31,146 |
| Microbial-05 | 7 | 112.0 | 206.0 | 2,964.43 | 430.50 | 732,180 |
| Microbial-06 | 5 | 245.0 | 621.0 | 1,358.66 | 1,614.00 | 249,115 |
| Gut-01 | 5 | 108.0 | 295.0 | 1,141.28 | 956.50 | 558,609 |
| Gut-02 | 5 | 101.0 | 239.0 | 923.43 | 619.50 | 268,741 |
| Gut-03 | 5 | 58.0 | 118.0 | 1,370.32 | 316.25 | 659,941 |
| Gut-04 | 5 | 117.0 | 284.0 | 1,134.10 | 1,042.00 | 494,907 |
| Gut-05 | 5 | 242.0 | 654.0 | 1,402.95 | 1,626.00 | 893,358 |
| Gut-06 | 5 | 119.0 | 464.0 | 2,009.43 | 1,592.00 | 1,035,677 |
| Oral-01 | 5 | 328.0 | 864.0 | 1,823.66 | 2,196.00 | 587,479 |
| Oral-02 | 5 | 164.0 | 535.0 | 1,456.93 | 1,412.00 | 772,292 |
| Oral-03 | 5 | 125.0 | 325.0 | 1,057.69 | 900.00 | 719,738 |
| Oral-04 | 5 | 140.0 | 382.0 | 1,065.24 | 953.00 | 540,453 |
| Oral-05 | 5 | 213.0 | 579.0 | 1,318.93 | 1,420.00 | 300,924 |
| Oral-06 | 5 | 193.0 | 489.0 | 1,194.06 | 1,233.00 | 317,137 |
# remove
# remove
# remove
if (file.exists(file.path(outDir, "ridgeLength.RDS"))) { ridgeLength <- readRDS(file.path(outDir, "ridgeLength.RDS")) } else { # remove
# remove
# remove
# remove
ridgeLength <- ggplot(summary, aes(x = log10(sequence_length_template + 1), y = factor(sample, levels = rev(sampleNames)), fill = ..x..)) + # first run on top, as in the table
geom_density_ridges_gradient(scale = 3, rel_min_height = 0.01) +
scale_fill_viridis(name = "Length, log10") +
labs(
x = "Length, log10",
y = "Run"
) +
theme_bw() +
theme(
axis.line = element_line(colour = "black"),
panel.grid.minor = element_blank(),
panel.border = element_blank(),
panel.background = element_blank(),
axis.text.x = element_text(angle = 0, vjust = 0, hjust = 0.5),
text = element_text(size = 12)
)
# remove
# remove
# remove
saveRDS(ridgeLength, file.path(outDir, "ridgeLength.RDS")) } # remove
# remove
# remove
# remove
print(ridgeLength)
3.2.5 Pore activity
for (sampleName in sampleNames) {
if (sampleName %in% names(poreL) & sampleName %in% names(summaryL)) {
summDf <- summaryL[[sampleName]]
if (sampleName %in% names(poreRun)) summDf <- summDf[startsWith(summDf$run_id, poreRun[[sampleName]]), ] # the run the pore activity file belongs to
binHours <- if (max(summDf$start_time) / 3600 > 10) 1 else 0.5 # 1-h bins for runs longer than 10 h, 30-min bins otherwise
secBreaks <- seq(-1, (max(summDf$start_time) + binHours * 3600), binHours * 3600)
summDf$TimeInGroup <- cut(summDf$start_time, breaks = secBreaks, labels = as.character(seq(binHours, (length(secBreaks) - 1) * binHours, binHours)))
tsvDf <- data.frame(
TimeInGroup = summDf$TimeInGroup,
Value = summDf$mean_qscore_template / 50 * 100,
Category = "Quality"
)
poreDf <- poreL[[sampleName]]
poreDf$Active <- "No"
poreDf$Active[which(poreDf$Channel.State %in% c("strand", "adapter"))] <- "Yes"
poreAct <- poreDf %>% group_by(Experiment.Time..minutes.) %>% summarise(Total = sum(State.Time..samples.), Live = sum(State.Time..samples.[Active == "Yes"]))
minBreaks <- seq(-1, (max(poreAct$Experiment.Time..minutes.) + binHours * 60), binHours * 60) # same bins as the read quality
poreAct$TimeInGroup <- cut(poreAct$Experiment.Time..minutes., breaks = minBreaks, labels = as.character(seq(binHours, (length(minBreaks) - 1) * binHours, binHours)))
poreAct <- poreAct %>% mutate(Prop = Live / Total)
csvDf <- data.frame(
TimeInGroup = poreAct$TimeInGroup,
Value = poreAct$Prop * 100,
Category = "Active pores"
)
poreActivityPlot <- poreActivity(df = rbind(csvDf, tsvDf), cols = c("#1B9E77", "#D95F02"))
cat("#### ", sampleName, "\n")
cat("\n")
cat(" * Read quality and pore activity over time.\n")
print(poreActivityPlot)
cat("\n\n")
} else {
summDf <- summaryL[[sampleName]]
binHours <- if (max(summDf$start_time) / 3600 > 10) 1 else 0.5 # 1-h bins for runs longer than 10 h, 30-min bins otherwise
secBreaks <- seq(-1, (max(summDf$start_time) + binHours * 3600), binHours * 3600)
timeLabels <- as.character(seq(binHours, (length(secBreaks) - 1) * binHours, binHours))
summDf$TimeInGroup <- cut(summDf$start_time, breaks = secBreaks, labels = timeLabels)
tsvDf <- data.frame(
TimeInGroup = summDf$TimeInGroup,
Value = summDf$mean_qscore_template / 50 * 100,
Category = "Quality"
)
csvDf <- data.frame( # dummy data for consistent visualization
TimeInGroup = timeLabels,
Value = rep(0, length(timeLabels)),
Category = "Active pores"
)
poreActivityPlot <- poreActivity(df = rbind(csvDf, tsvDf), cols = c("#1B9E77", "#D95F02"))
cat("#### ", sampleName, "\n")
cat("\n")
cat(" * _MinKNOW_ failed to produce a pore activity report.\n")
print(poreActivityPlot)
cat("\n\n")
}
}3.2.5.1 Microbial-01
- Read quality and pore activity over time.

3.2.5.2 Microbial-02
- Read quality and pore activity over time.

3.2.5.3 Microbial-03
- Read quality and pore activity over time.

3.2.5.4 Microbial-04
- MinKNOW failed to produce a pore activity report.

3.2.5.5 Microbial-05
- Read quality and pore activity over time.

3.2.5.6 Microbial-06
- Read quality and pore activity over time.

3.2.5.7 Gut-01
- Read quality and pore activity over time.

3.2.5.8 Gut-02
- Read quality and pore activity over time.

3.2.5.9 Gut-03
- Read quality and pore activity over time.

3.2.5.10 Gut-04
- Read quality and pore activity over time.

3.2.5.11 Gut-05
- Read quality and pore activity over time.

3.2.5.12 Gut-06
- Read quality and pore activity over time.

3.2.5.13 Oral-01
- Read quality and pore activity over time.

3.2.5.14 Oral-02
- Read quality and pore activity over time.

3.2.5.15 Oral-03
- Read quality and pore activity over time.

3.2.5.16 Oral-04
- Read quality and pore activity over time.

3.2.5.17 Oral-05
- Read quality and pore activity over time.

3.2.5.18 Oral-06
- Read quality and pore activity over time.

3.3 Barcode-level summary
- Barcode-level statistics are from NanoPlot on each barcode’s FASTQ (all reads of the run’s one sample barcode, with no quality-score filter).
- Reads that were not assigned to a barcode (unclassified) are not included, so the number of reads shown in the Figures below is lower than that presented in the Figures above.
3.3.1 Import data
data <- read.table(file.path(baseDir, "Data", "NanoStats_summary.txt"), header = T, stringsAsFactors = F, sep = "\t")
data$Plate <- sapply(str_split(data$Plate_Barcode, "_"), "[[", 1)
data$Plate <- factor(data$Plate, levels = sampleNames)
data$Barcode <- sapply(str_split(data$Plate_Barcode, "_"), "[[", 2)
data <- data[order(data$Plate), ] # run order as everywhere else in the report
head(data[,c("Plate", "Barcode", "number_of_reads", "n50")])## Plate Barcode number_of_reads n50
## 7 Microbial-01 barcode21 1385 3730
## 8 Microbial-02 barcode23 656 4242
## 9 Microbial-03 barcode01 5195 1876
## 10 Microbial-04 barcode03 6222 3437
## 11 Microbial-05 barcode05 541 1812
## 12 Microbial-06 barcode09 58109 30433.3.2 Per-run statistics
- One sample barcode per run, so each statistic is a single value per run.
statDf <- data.frame(
Run = data$Plate,
Barcode = data$Barcode,
Reads = format(data$number_of_reads, big.mark = ","),
Bases = format(data$number_of_bases, big.mark = ","),
N50 = format(data$n50, big.mark = ","),
`Length, median` = format(data$median_read_length, big.mark = ","),
`Length, mean` = format(data$mean_read_length, big.mark = ",", nsmall = 1),
`Quality, median` = data$median_qual,
`Quality, mean` = data$mean_qual,
check.names = FALSE
)
kable(statDf, align = c("l", "l", rep("r", 7)), row.names = FALSE)| Run | Barcode | Reads | Bases | N50 | Length, median | Length, mean | Quality, median | Quality, mean |
|---|---|---|---|---|---|---|---|---|
| Microbial-01 | barcode21 | 1,385 | 1,121,836 | 3,730 | 139.0 | 810.0 | 16.5 | 12.8 |
| Microbial-02 | barcode23 | 656 | 796,257 | 4,242 | 254.0 | 1,213.8 | 18.0 | 13.5 |
| Microbial-03 | barcode01 | 5,195 | 3,957,279 | 1,876 | 310.0 | 761.7 | 16.4 | 12.9 |
| Microbial-04 | barcode03 | 6,222 | 8,011,921 | 3,437 | 444.5 | 1,287.7 | 16.8 | 12.9 |
| Microbial-05 | barcode05 | 541 | 353,362 | 1,812 | 223.0 | 653.2 | 15.0 | 11.3 |
| Microbial-06 | barcode09 | 58,109 | 82,384,087 | 3,043 | 672.0 | 1,417.8 | 16.7 | 14.2 |
| Gut-01 | barcode15 | 8,245 | 10,060,717 | 3,117 | 438.0 | 1,220.2 | 15.0 | 12.1 |
| Gut-02 | barcode17 | 2,624 | 2,107,273 | 1,846 | 336.0 | 803.1 | 15.3 | 13.0 |
| Gut-03 | barcode19 | 1,683 | 1,184,875 | 2,245 | 213.0 | 704.0 | 15.8 | 12.5 |
| Gut-04 | barcode07 | 5,353 | 8,395,868 | 3,549 | 716.0 | 1,568.4 | 16.5 | 13.9 |
| Gut-05 | barcode11 | 30,108 | 44,944,736 | 3,006 | 775.0 | 1,492.8 | 17.3 | 15.0 |
| Gut-06 | barcode13 | 18,862 | 33,689,213 | 3,749 | 913.0 | 1,786.1 | 16.0 | 13.6 |
| Oral-01 | barcode05 | 263,381 | 486,835,086 | 3,887 | 933.0 | 1,848.4 | 21.3 | 16.5 |
| Oral-02 | barcode07 | 198,084 | 292,715,856 | 3,724 | 635.0 | 1,477.7 | 20.6 | 15.9 |
| Oral-03 | barcode09 | 172,739 | 178,084,835 | 3,183 | 356.0 | 1,030.9 | 19.8 | 15.1 |
| Oral-04 | barcode11 | 147,603 | 155,960,335 | 2,945 | 419.0 | 1,056.6 | 20.0 | 15.4 |
| Oral-05 | barcode13 | 53,383 | 73,214,440 | 3,121 | 644.0 | 1,371.5 | 20.8 | 16.7 |
| Oral-06 | barcode15 | 69,130 | 84,264,042 | 2,957 | 536.0 | 1,218.9 | 20.2 | 15.3 |
3.3.3 Read quality
qualDf <- data.frame(
Plate = data$Plate,
Barcode = data$Barcode,
Lt10 = data$number_of_reads - data$Reads..Q10._count,
Gt10Lt15 = data$Reads..Q10._count - data$Reads..Q15._count,
Gt15lt20 = data$Reads..Q15._count - data$Reads..Q20._count,
Gt20lt25 = data$Reads..Q20._count - data$Reads..Q25._count,
Gt25lt30 = data$Reads..Q25._count - data$Reads..Q30._count,
Gt30 = data$Reads..Q30._count
)
qDf <- melt(qualDf, value.name = "Count")
colnames(qDf) <- c("Plate", "Barcode", "Quality", "Count")
qDf$Quality <- factor(qDf$Quality, levels = c("Gt30", "Gt25lt30", "Gt20lt25", "Gt15lt20", "Gt10Lt15", "Lt10"), labels = c(">=30", ">=25 and <30", ">=20 and <25", ">=15 and <20", ">=10 and <15", "<10"))
ggplot(qDf, aes(x = Plate, y = Count, fill = Quality)) +
geom_bar(position="fill", stat="identity") +
labs(
x = "Run",
y = "Proportion"
) +
theme_bw() +
theme(
axis.line = element_line(colour = "black"),
panel.grid.minor = element_blank(),
panel.border = element_blank(),
panel.background = element_blank(),
axis.text.x = element_text(angle = 45, vjust = 1, hjust = 1),
text = element_text(size = 12)
) + scale_fill_grey()
4 SessionInfo
si <- sessioninfo::session_info(pkgs = "attached")
si$platform$date <- NULL # no timestamps on public pages
si$platform$tz <- NULL
si$platform$pandoc <- NULL
si$platform$quarto <- NULL
si## ─ Session info ───────────────────────────────────────────────────────────────
## setting value
## version R version 4.5.1 (2025-06-13)
## os macOS Tahoe 26.7.1
## system aarch64, darwin20
## ui X11
## language (EN)
## collate en_CA.UTF-8
## ctype en_CA.UTF-8
##
## ─ Packages ───────────────────────────────────────────────────────────────────
## package * version date (UTC) lib source
## cowplot * 1.2.0 2025-07-07 [1] CRAN (R 4.5.0)
## dplyr * 1.1.4 2023-11-17 [1] CRAN (R 4.5.0)
## ggplot2 * 4.0.1 2025-11-14 [1] CRAN (R 4.5.2)
## ggrepel * 0.9.6 2024-09-07 [1] CRAN (R 4.5.0)
## ggridges * 0.5.7 2025-08-27 [1] CRAN (R 4.5.0)
## ggsankey * 0.0.99999 2025-11-04 [1] Github (davidsjoberg/ggsankey@b675d0d)
## knitr * 1.51 2025-12-20 [1] CRAN (R 4.5.2)
## RColorBrewer * 1.1-3 2022-04-03 [1] CRAN (R 4.5.0)
## reshape2 * 1.4.5 2025-11-12 [1] CRAN (R 4.5.0)
## sessioninfo * 1.2.3 2025-02-05 [1] CRAN (R 4.5.0)
## stringr * 1.6.0 2025-11-04 [1] CRAN (R 4.5.0)
## viridis * 0.6.5 2024-01-29 [1] CRAN (R 4.5.0)
## viridisLite * 0.4.2 2023-05-02 [1] CRAN (R 4.5.0)
## yaml * 2.3.12 2025-12-10 [1] CRAN (R 4.5.2)
##
## [1] /Library/Frameworks/R.framework/Versions/4.5-arm64/Resources/library
## * ── Packages attached to the search path.
##
## ──────────────────────────────────────────────────────────────────────────────