A Resource Benchmark of Human Microbiota–Associated Mouse Models Reveals Donor-Dominated Outcomes
Updated on June 05, 2026
Contents |
Color key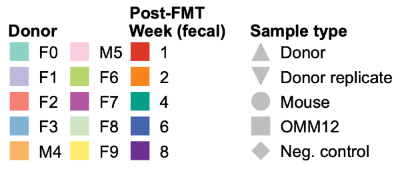
|
Introduction
- Background
- HMA rodent models are widely used for causal microbiome-phenotype studies, but the ~95% reported phenotype-transfer rate overstates microbiome causality, and donor taxa frequently fail to colonize or diverge from donor profiles in recipients Walter et al. (2020).
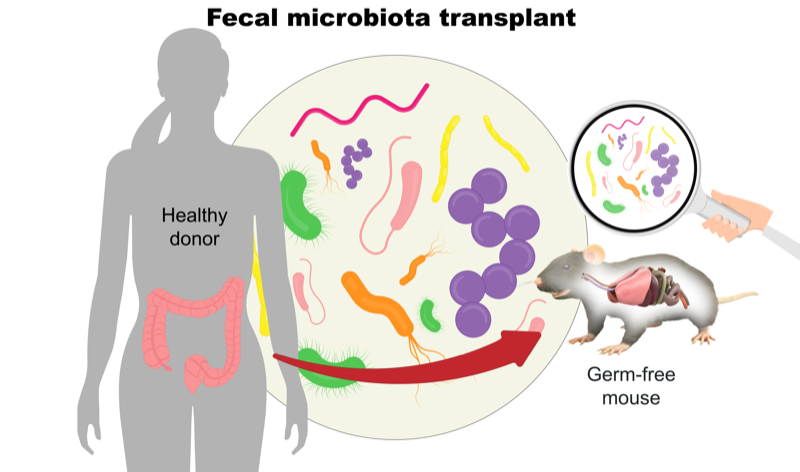
- MICROBENCH addresses this with a longitudinal metagenomic benchmarking resource: 10 donors × germ-free C57BL/6 recipients, profiled by long-read shotgun metagenomics for bacterial community composition and mycobiome/virome fractions across fecal and intestinal (Colon, Ileum, Cecum) samples. This report covers the metagenomics component; the companion metabolomic and immune analyses are reported separately.
- Rationale
- Donor-to-recipient transfer fidelity is rarely quantified rigorously across donors, time points, and gut compartments within a single experiment; existing HMA benchmarks are typically limited in donor number or sampling breadth.
- A longitudinal metagenomic dataset spanning multiple donors, time points, and gut compartments is therefore needed as a community-level benchmark for HMA studies and FMT trial design.
- Objective
- Deliver MICROBENCH and a donor-tailored long-read metagenomics pipeline as a calibrated reference for future HMA cohorts and FMT trial designs.
- Aims of the study
- Generate a longitudinal metagenomic benchmarking dataset of germ-free C57BL/6 mice colonized by fecal microbiota transfer from 10 healthy human donors, profiled for bacterial community composition and mycobiome/virome fractions across fecal and intestinal (Colon, Ileum, Cecum) samples.
- Quantify donor-to-recipient transfer fidelity across fecal and intestinal compartments and over the post-FMT time course (Weeks 1–8).
- Establish and release an end-to-end long-read metagenomics pipeline for HMA studies—comprising donor-tailored reference database construction, read-level compositional quality control, and genome-size-aware species-level abundance estimation—so that the dataset and pipeline together yield reference statistics for donor-to-recipient microbiota transfer that can be used to benchmark future HMA studies and support FMT trial design.
Analysis-ready dataset
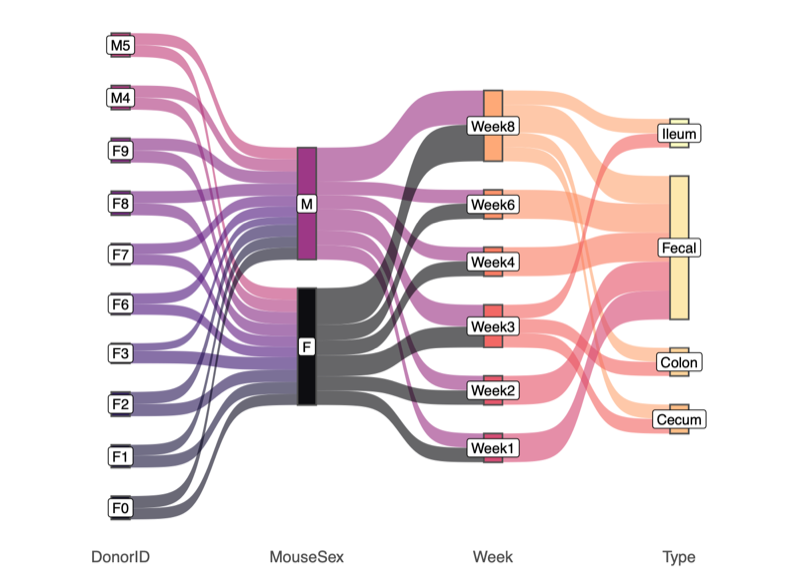
- Donors, N=10
- Eight female (F) and two male (M) healthy donors
- Samples (post-QC), N=1,249
- Donor, N=10
- Donor replicates, N=9 (F1 not replicated)
- OMM12, N=12
- Neg. control, N=8
- Mouse, N=1,210
- Modality × tissue × timepoint
- Sample naming convention
- Donor sex/ID: [ F0 | F1 | F2 | F3 | M4 | M5 | F6 | F7 | F8 | F9 | Ctrl (OMM12) | Neg (neg. control)]
- Mouse sex/ID: [ M | F ] + Mouse ID
- Mouse age: [ 0 (donor) | 1 | 2 | 3 | 4 | 6 | 8 | X (neg) ]
- Sample type: [ C (colon) | F (fecal) | I (ileum) | M (cecum) | Ctrl | Neg | 1 (donor) | 2 (donor) ]
- F0_F20_6_F: Fecal sample from 6-week-old female mouse #20 derived from female donor #0
- M5_F509_3_M: Cecum sample from 3-week-old female mouse #509 derived from male donor #5
- F6_NA_0_1: 1st fecal sample from female donor #6
- Ctrl_Ctrl3_3_Ctrl: Control sample from the OMM12 group
- Neg_6_X_Neg: Negative control sample
| Modality | Tissue(s) | Weeks post-FMT |
|---|---|---|
| Bacterial metagenomics (long-read) | Fecal (F) | 0 (donor), 1, 2, 4, 6, 8 |
| Colon (C), Ileum (I), Cecum (M) | 3, 8 | |
| Mycobiome / Virome (long-read) | Fecal (F) | 1, 2, 4, 6, 8 |
-
Donor sex/ID _ Mouse sex/ID _ Mouse age (weeks) _ Sample type
Examples:
Methods
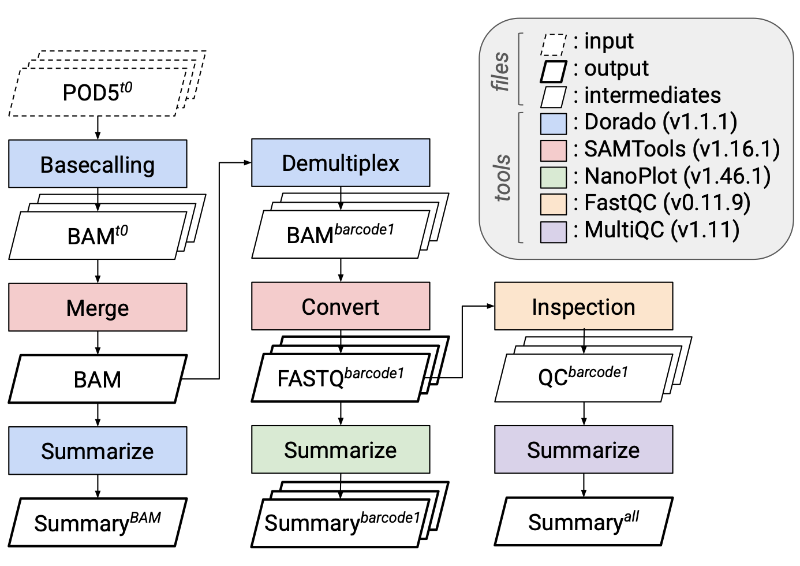
Click each item to expand.Sequencing and basecalling
- Long-read sequencing on Oxford Nanopore Technologies (ONT) PromethION flow cells
- Dorado (v1.1.1): basecalling from POD5 with model
dna_r10.4.1_e8.2_400bps_sup@v5.2.0 - Read filtering policy: reads shorter than 35 bp ignored by Kraken2 during classification; reads longer than 15,000 bp trimmed to 15,000 bp; reads longer than 100,000 bp excluded
- NanoPlot De Coster and Rademakers (2023): per-read length, quality, and yield metrics for long-read data
- MultiQC Ewels et al. (2016): aggregates QC reports from many tools into a single summary report
- FastQC: per-read quality control checks
- SAMtools Danecek et al. (2021): manipulate and inspect alignment files
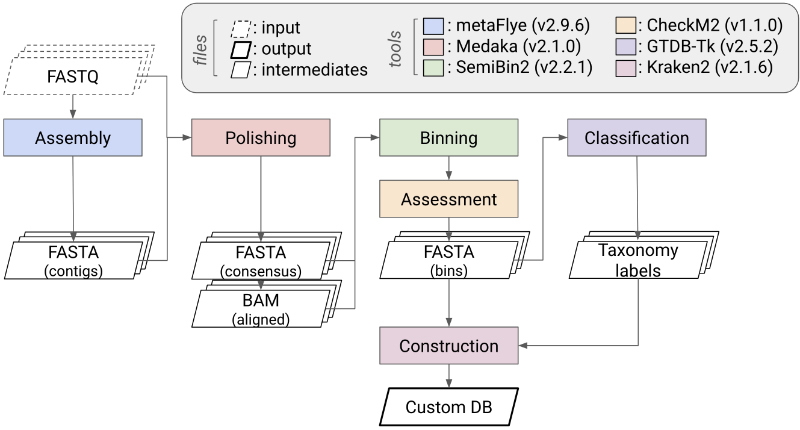
Donor-derived MAG reference catalogue
- metaFlye Kolmogorov et al. (2020): long-read metagenome assembly using repeat graphs
- SemiBin2 Pan et al. (2023): semi-supervised metagenomic binning
- Medaka (v2.1.1): consensus polishing of long-read assemblies
- GTDB-Tk Chaumeil et al. (2022): standardized taxonomy assignment for bacterial and archaeal genomes
- Output: 388 initial bins → 165 non-redundant donor-derived MAGs defining the feature universe for the custom Kraken2 database
Taxonomic classifier evaluation and selection
- Kraken2 Wood et al. (2019): k-mer-based per-read taxonomic classification — selected as the primary classifier
- Minimap2 Li (2018) + CoverM Aroney et al. (2025): alignment-based read mapping and coverage estimation (comparator)
- MetaPhlAn 4 (Metagenomic Phylogenetic Analysis) Blanco-Míguez et al. (2023): marker-gene profiling (comparator)
- Sylph Shaw and Yu (2025): ANI/sketch-based profiling (comparator)
- Selection criteria: support for fully customizable databases, per-read assignment outputs, and operational scalability under control-sample benchmarking (OMM12 only vs decoy-inclusive databases)
Species-level abundance estimation and read-level QC
- basen (v1.0.0): Base-level Abundance estimation with Species-assigned Evidence using Nanopore — species-rank evidence aggregated from per-read Kraken2 k-mer assignments, normalized by reference genome length to a coverage proxy, and rescaled within sample to relative abundance
- Read-level compositional QC (basen): two-step filter using (1) the proportion of unassigned k-mers per read (excluded if >75%) and (2) the Shannon diversity of the per-read TaxID assignment profile (threshold >1.0 for high-depth donors, >0.75 for shallower mouse, replicate, and control samples)
Mycobiome and virome profiling
- Reads unclassified against the custom donor-derived Kraken2 database were re-classified against the k2_pluspf (fungi, protozoa) and k2_viral databases
- Reads unmapped to both fungal and viral indices were screened against the mouse (GRCm39) and human (GRCh38) reference genomes
- Donor-level cross-domain correlations: Spearman with Phipson–Smyth permutation p-values Phipson and Smyth (2010), BH correction within each kingdom-pair family
Procrustes analysis of cross-kingdom community structure
- Symmetric Procrustes superimposition via
vegan::procrustes/protest; m2 statistic and permutation p-value (999 permutations) - Donor-level centroid displacement vectors clustered with Euclidean distance and complete linkage
- Symmetric Procrustes superimposition via
Results
This report covers the metagenomics component of MICROBENCH only. Section A (Pre-processing) expands on pipeline-internal results that the manuscript describes only briefly; Section B (Microbiome) presents the bacterial community results (Figs 1–2)A. Pre-processing
Pipeline-internal steps described only briefly in the manuscript and expanded here with full detail: sequencing QC, classifier benchmarking, donor-derived custom Kraken2 database construction, basen method development, read-level compositional QC, and donor technical-replicate validation.- Experimental design
- Oxford Nanopore Technology
- Total number of barcodes sequenced on the PromethION.
- Twenty one barcodes from Plate 14 yielded zero reads.Plate14_barcode01
Plate14_barcode02
Plate14_barcode03
Plate14_barcode04
Plate14_barcode57
Plate14_barcode58
Plate14_barcode59
Plate14_barcode65
Plate14_barcode66
Plate14_barcode67
Plate14_barcode73
Plate14_barcode74
Plate14_barcode75
Plate14_barcode81
Plate14_barcode82
Plate14_barcode83
Plate14_barcode88
Plate14_barcode89
Plate14_barcode90
Plate14_barcode91
Plate14_barcode96 - Twenty nine samples were excluded due to poor quality. These samples showed a read quality value of 0 for all reads in the Dorado summary output.Plate05_barcode40
Plate05_barcode67
Plate05_barcode85
Plate05_barcode86
Plate05_barcode87
Plate05_barcode88
Plate05_barcode89
Plate05_barcode90
Plate05_barcode91
Plate05_barcode92
Plate05_barcode93
Plate05_barcode94
Plate05_barcode95
Plate05_barcode96
Plate06_barcode88
Plate08_barcode20
Plate08_barcode39
Plate08_barcode50
Plate09_barcode08
Plate09_barcode24
Plate09_barcode32
Plate09_barcode88
Plate10_barcode88
Plate11_barcode24
Plate11_barcode48
Plate11_barcode79
Plate11_barcode80
Plate13_barcode22
Plate13_barcode88 - Basecalling
- MinKNOW does not include the most recent Dorado basecaller.
- Using the POD5 files, we executed the latest release of Dorado (v1.1.1; October 9, 2025) on high-performance computing clusters.
- Model used: dna_r10.4.1_e8.2_400bps_sup@v5.2.0
- A code set for reproducibility: Griffin-Pipeline tutorials
- Workflows
- Basecalling and demultiplex results
- Quality assessment
- Dorado Run Analyzer
- Sequencing data summary: reads, quality, N50, etc.
- MultiQC results
- Detailed MultiQC results: (1) per plate, (2) per barcode, and (3) by read length, with reads triaged by length
- Samples included in the downstream analysis
- Total: 1,249 samples
- 10 donor samples
- 9 donor replicates (low depth)
- 12 OMM12 controls
- 8 negative controls
- 1,210 mice (see Sankey plot below)
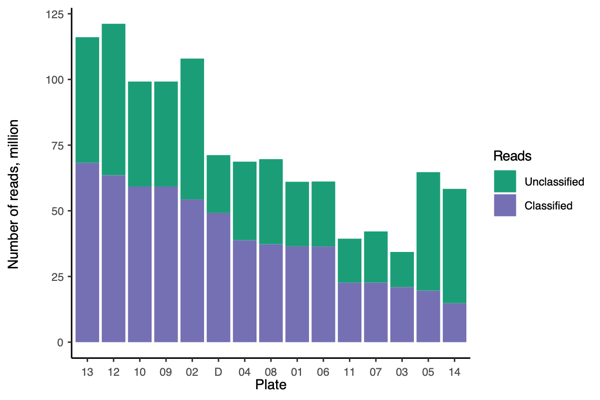
- Read quality control
- MultiQC summary: per-base read quality
- Mini conclusion: Based on the MultiQC summary above, we applied length-based read filtering as follows:
- Short reads were retained, as Kraken2 ignores reads shorter than 35 bp
- Long reads were trimmed to 15,000 bp
- Ultra-long reads (>100,000 bp) were discarded
- Post-QC Stats
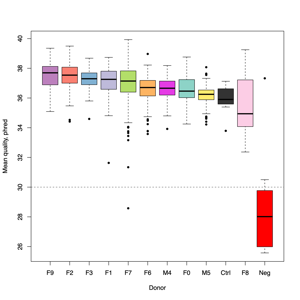
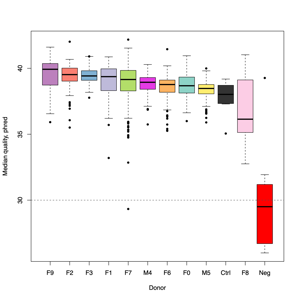
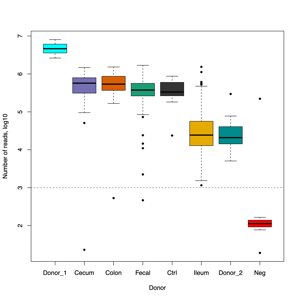
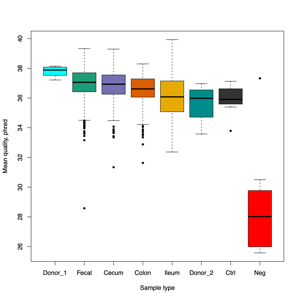
- FASTQ stats: number of reads and mean/SD/median quality
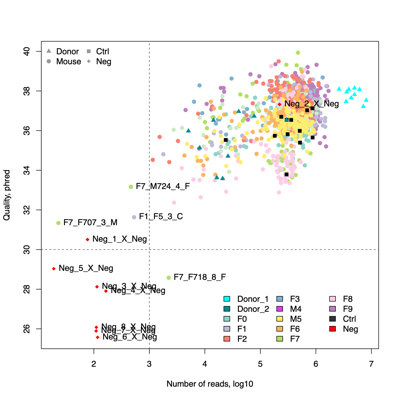
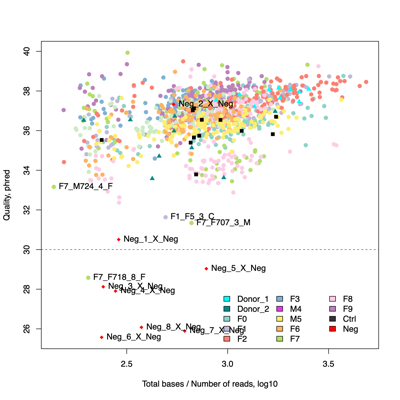
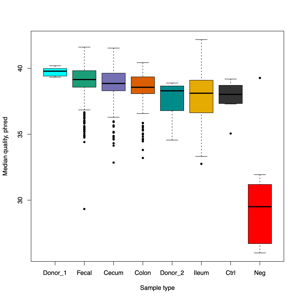
- Read length and quality
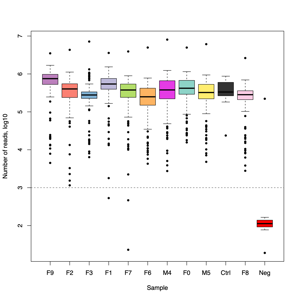
- Read length and quality per donor
- Read length and quality per sample type
- Four samples are candidates for exclusion from downstream analysis because of low read counts and/or poor read quality, in addition to eight negative controls.F1_F5_3_C
F7_F707_3_M
F7_F724_4_F
F7_F718_8_F
Neg_1_X_Neg
Neg_2_X_Neg
Neg_3_X_Neg
Neg_4_X_Neg
Neg_5_X_Neg
Neg_6_X_Neg
Neg_7_X_Neg
Neg_8_X_Neg - Classifier evaluation
- Input: control OMM12 samples, N=12 (Ctrl01 - Ctrl12)
- Tools comparison:
- Classification results
- Note 1: MetaPhlAn 4.2, run with its pre-built database, did not classify any reads in the OMM12 samples.
- Note 2: taxonomic abundance was estimated using CoverM following read alignment with Minimap2.
- Read-level investigation 1: using the OMM12 DB
- 1:1 comparison of reads assigned to CP015399 (blue) and CP015401 (green) in the Ctrl01 sample
Minimap2+CoverM CP015399 CP015401 Total Kraken2 CP015399 C1 110,900 C2 2 110,902 CP015401 C3 1,105 C4 464,266 465,371 Total 112,005 464,268 576,273 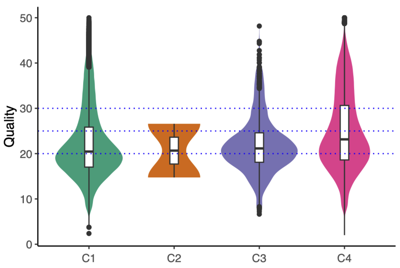
- BLAST (Basic Local Alignment Search Tool) was used to examine one of the two reads in cell 2 (C2) that were assigned to CP015399 by Kraken2 but to CP015401 by Minimap2+CoverM
- Read ID: 0ff4c7d3-1108-4a12-b7ba-5e15912d901e (length: 400 bp / quality: 26.6)
ATGGAGCCGTAAGCGGCTTTATAGGGATCGTAGGAACCGTCCAGGCCCTTGGCTTTTTTG
TAGGCCTTAAGCTGCCTGATGATGTGGTTGGCGTATTTGGGATTGTTTTCCGTCACCCAT
GCCTCAATACCGGAAGTGTCAAAGAGGAGCATGGAAGCTTTTTCCTTATTGATTTTCTGG
CAGATTGGTTCAGTCAGGTCAACAAGGCGGCTGAACATGGATTGTATGGAAGCAAAGTTC
ACCTGTGTTGAAATATTCTGTTCCCACGGTTCGATATCCAGTGGATAAGTATCCGTCATC
ACATCATCCTCATAAAAATACTCGTCGGCCAATCCGCCGAAGCTGTGTCCGAATTCGTGC
ACTACCACCGGTTTGAACATGGGGTGATGTGCCGTGGTCA - BLAST results:
1-226 bp: 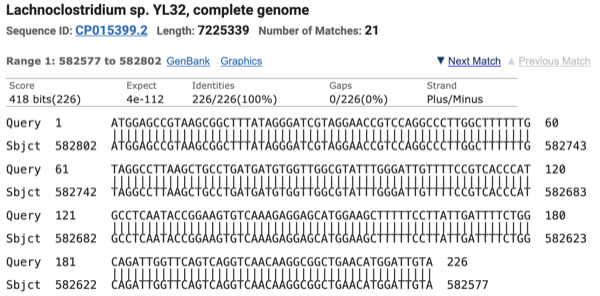
227-400 bp: 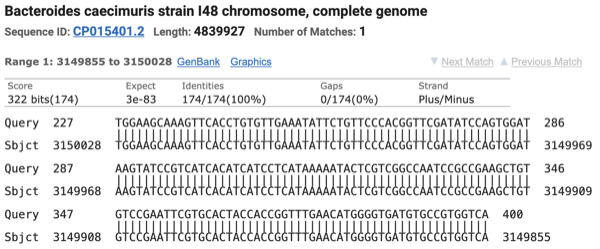
- Minimap2 is unable to align the 1–226 bp segment of the read to CP015399
- Minimap2 problem definition: Minimap2 relies on minimizers as alignment anchors but discards high-frequency k-mers, and in repetitive regions this anchor loss disrupts chaining and results in missed alignments
- Read-level investigation 2: using the DECOY DB
- One high-quality read was identified that mapped to the DECOY genome
- Read ID: 76502669-ef64-431a-97f5-81ae8693f48a (length: 255 bp / quality: 46.2)
AGCACCTTACTTTATACACATGAGCCATGATATGGGCTTGCATGCGGAAGTGGAAAAGAG
TCTTCCGGAAAATATTCACCTGGCATTCGACGGATTGGATATCTATCTTTGATTATTGGT
GAATTTTTTAGTAAAAGTTTTGTTTTCTTTGTAGAAATTATTATTTTTGCACCTAGCCGA
TAAACAGCGAATATTATGAAACTTCGTACGATAGTGAAAATAGCGATCACGTCTTCTGTT
GTACTTTTGTGCTCA - Kraken2 results:
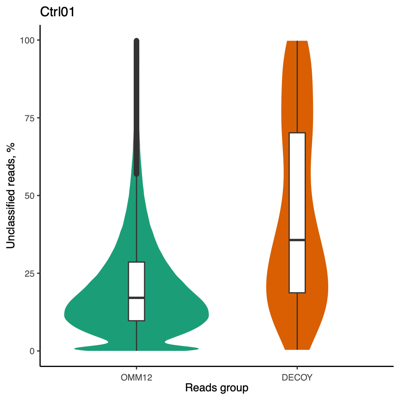
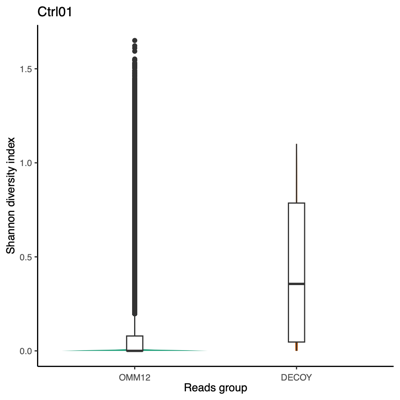
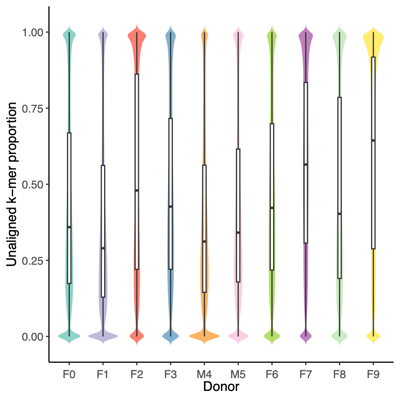
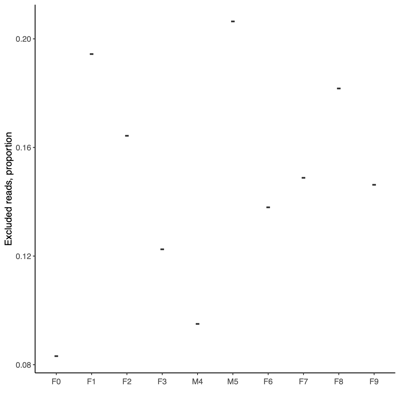
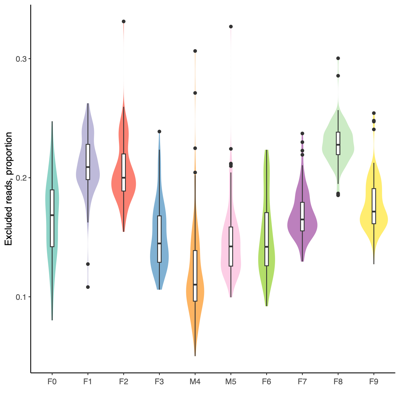
Taxon ID Group Scientific name Hit(s) % 816 Bacteroides (genus) 71 32.1 2763022 DECOY Bacteroides sp. M10 50 22.6 1796613 OMM12 Bacteroides caecimuris strain I48 49 22.2 0 Unclassified 51 23.1 Total 222 100.0 - Proportion of unclassified reads (erratum: "Reads Group" in the Figure should be replaced with "Database"):
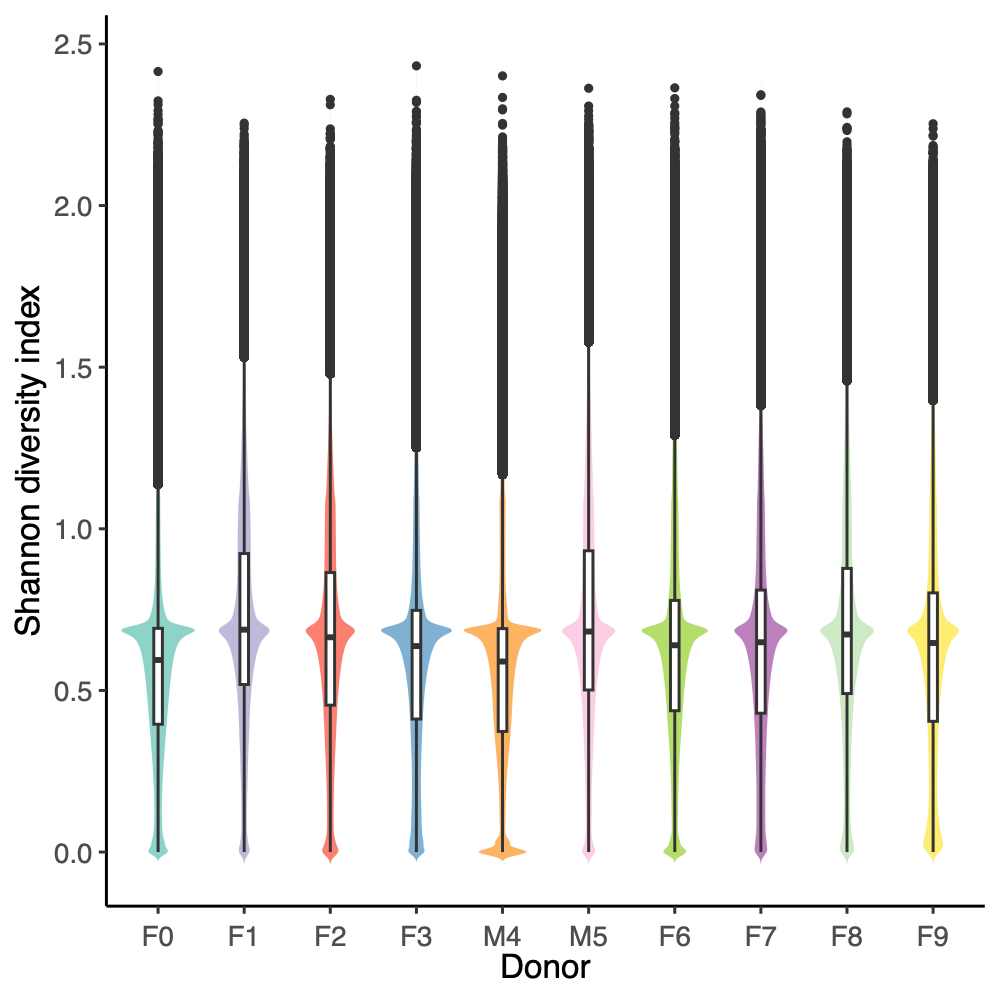
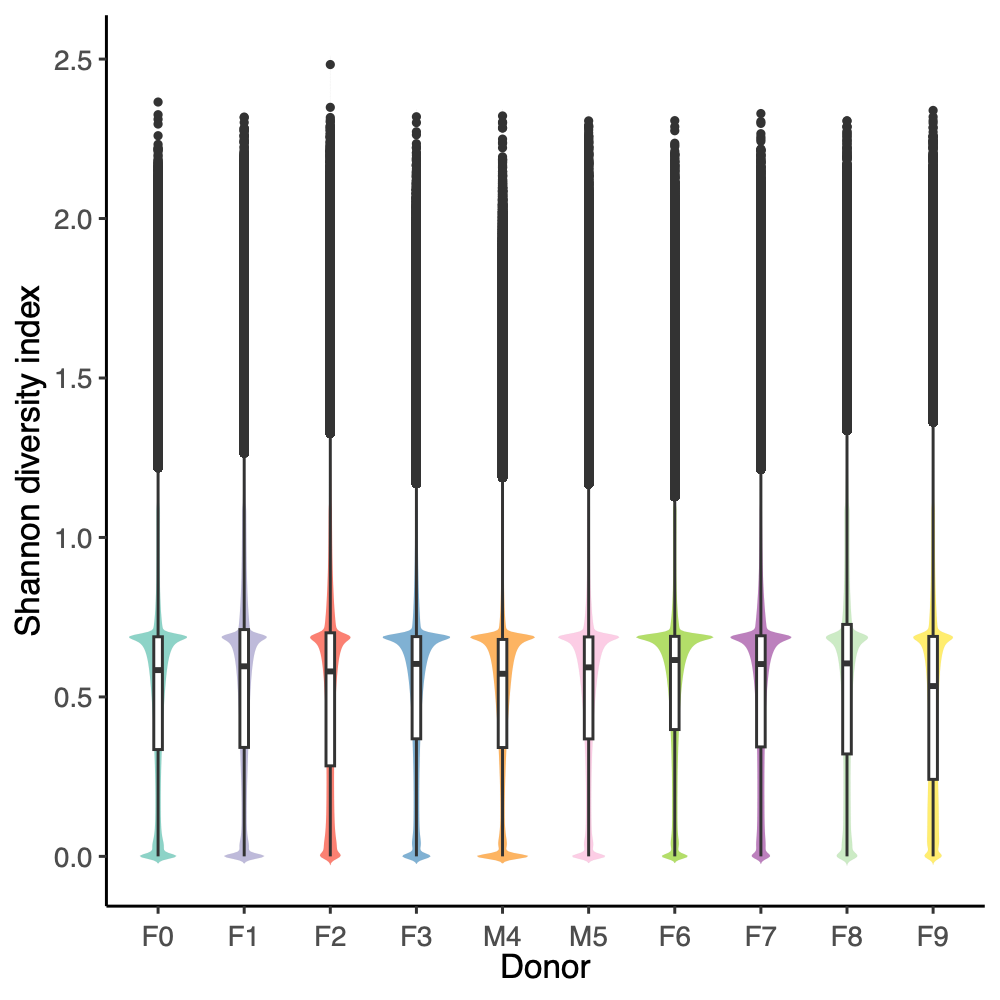
- Shanon diversity index:
Using all taxon IDs assigned to each read After removing taxon ID 0 (unclassified) from each read 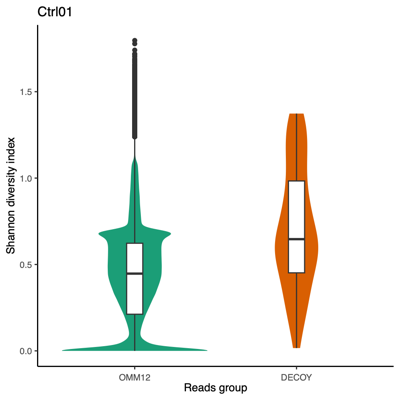
- Mini conclusion: We require a classifier that supports fully customizable databases and avoids biases introduced by sampling or repeat filtering; Kraken2 satisfies both criteria, making it the preferred tool over Minimap2, MetaPhlAn, and Sylph.
- Create a custom Kraken2 database tailored to the microbial community of interest
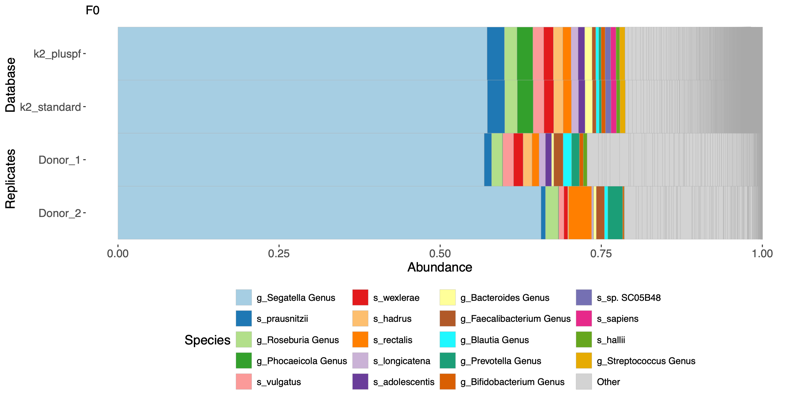
- Input: donor samples from the Donor plate (higher depth), N=10 (F0, F2, ..., F9)
- Workflows
- Stats:
- Taxonomy labels: GTDB-Tk results and Genome list, N=165
- Taxonomy classification via Kraken2 with the custom DB (165)
- Input, N=19
- Sequenced using 10 barcodes on a 96-well plate to achieve high(er) coverage (*_NA_0_1), N=10
- An additional set of donor samples was sequenced on separate plates, providing comparable read depth for cross-validation (*_NA_0_2), N=9 F1_NA_0_2 sample was not included in the profiling
- Reference databases:
- Custom DB with Donors
- k2_standard: Refseq archaea, bacteria, viral, plasmid, human genome, and a collection of known vectors
- K2_pluspf: k2_standard plus Refseq protozoa and fungi
- Taxonomy classification:
- Problem definitions:
- Raw taxonomy classification outputs (e.g., read counts) are not directly comparable across samples (sequencing depth varies substantially between runs, flow cells, and barcodes)
- Differences in total classified reads can artificially inflate or deflate apparent taxon abundance (even when the underlying biological composition is similar)
- Taxonomic assignments at different ranks (e.g., genus vs. species) are not on the same scale (preventing consistent comparison across classification levels)
- Develop a method to calculate relative abundance
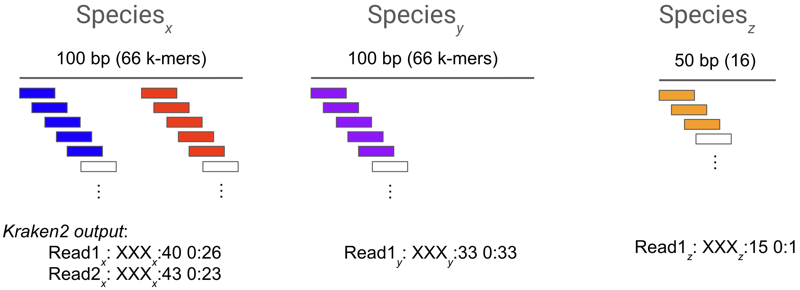
- BASEN: Base-level Abundance estimation with Species-assigned Evidence using Nanopore
- Summary: BASEN estimates species-level relative abundance by quantifying species-assigned k-mers from long-read sequencing data, normalizing by reference genome length, and scaling across detected species to obtain genome-size–corrected relative abundances.
- Conceptual figure:
- Relative abundance: Legend
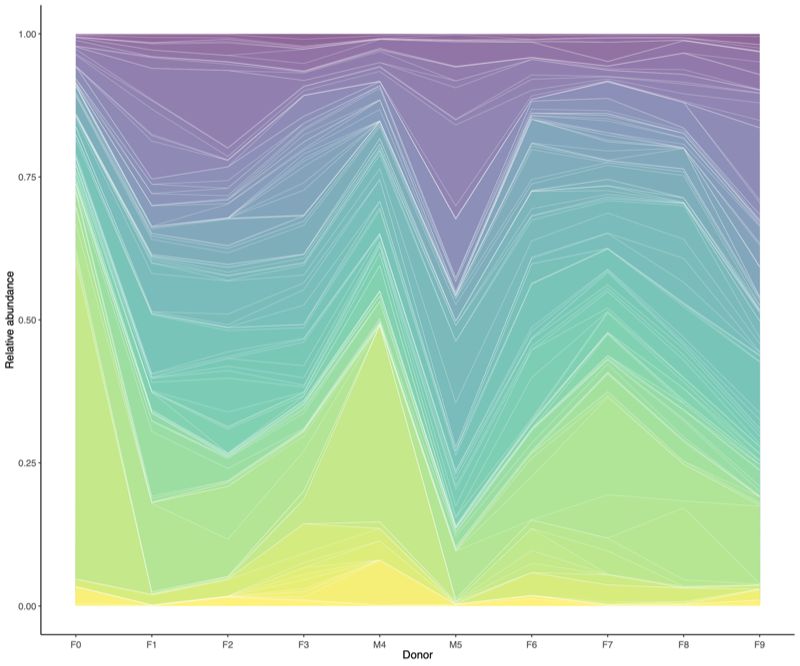
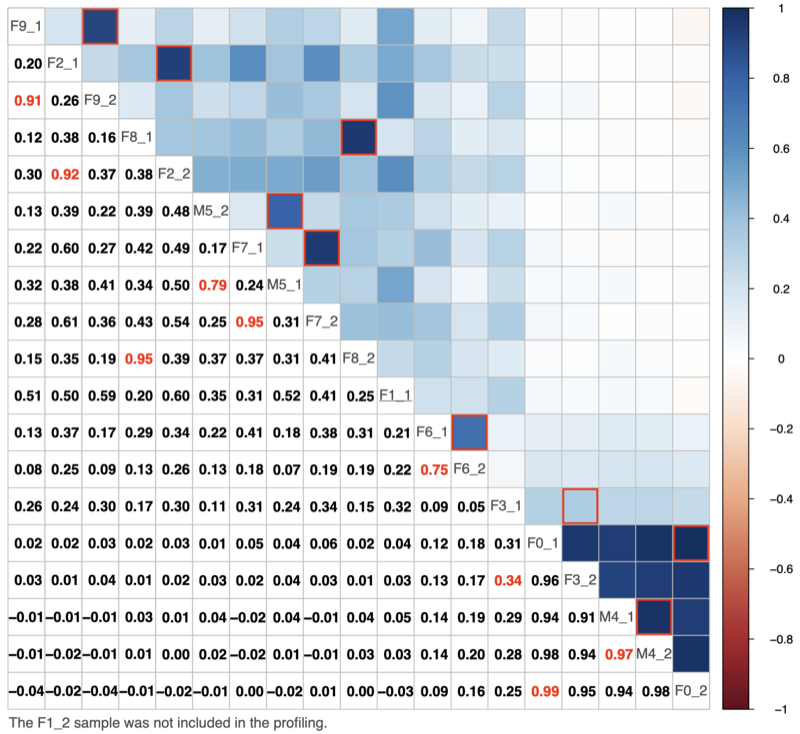
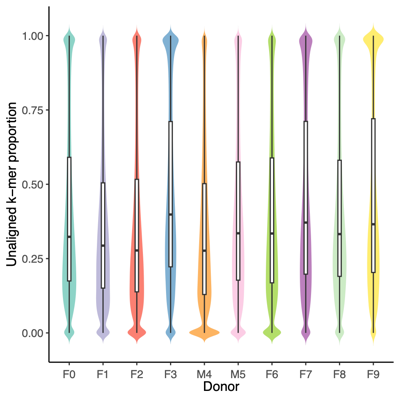
- Correlation among donors:
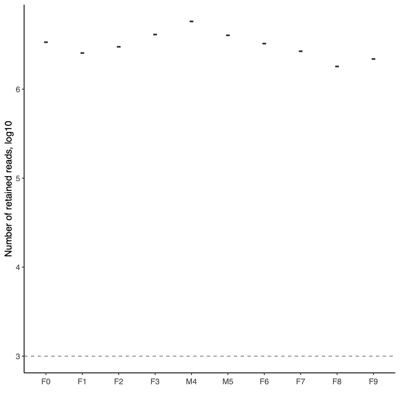
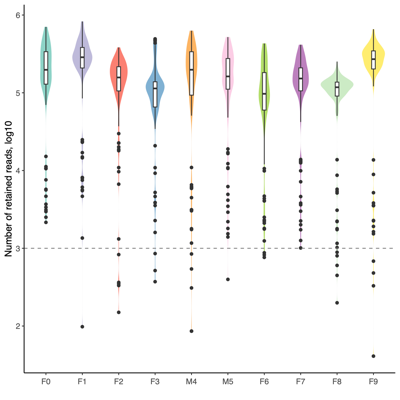
- Filter low quality reads
- Input: 1,249 samples
- Mice samples, , N=1,210
- Donor samples, N=10
- Donor replicates, N=9
- OMM12 controls, N=12
- Neg. controls, N=8 Relative abundances of the donor replicates and OMM12/negative controls were calculated, but their distributions were omitted from the figures below.
- Filter reads based on unclassified reads, i.e., unaligned k-mers, and Shannon diversity index from Kraken2 k-mer strings (refer to the Results Section 8 above)
- Threshold values:
- Unaligned k-mers, proportion: >0.75
- Shannon diversity index: >1.00 (Donor) and >0.75 (Mice, Donor replicates, OMM12 control)
| Plate | # Barcodesi | # Sequencedii | # Samplesiii |
|---|---|---|---|
| Donors | 10 | 10 | 10 |
| 01 | 96 | 96 | 96 |
| 02 | 96 | 96 | 96 |
| 03 | 96 | 96 | 96 |
| 04 | 96 | 96 | 96 |
| 05 | 96 | 96 | 82 |
| 06 | 96 | 96 | 95 |
| 07 | 96 | 96 | 96 |
| 08 | 96 | 96 | 93 |
| 09 | 96 | 96 | 92 |
| 10 | 96 | 96 | 95 |
| 11 | 96 | 96 | 92 |
| 12 | 96 | 96 | 96 |
| 13 | 96 | 96 | 94 |
| 14 | 41 | 20 | 20 |
| Total | 1,299 | 1,278 | 1,249 |
| Number of reads and Quality | Ave. read lenth and Quality |
|---|---|
 |
 |
| Number of reads | Mean quality | Median quality |
|---|---|---|
 |
 |
 |
| Number of reads | Mean quality | Median quality |
|---|---|---|
 |
 |
 |
| Category | Kraken2 | Minimap2 | MetaPhlAn 4.2 | Sylph |
|---|---|---|---|---|
| Features | k-mer based | alignment-based | marker gene-based | ANI-based |
| Support long-reads? | yes | yes | yes (v4.2) | yes |
| Custom DB support? | yes | yes | no | yes |
| Strengths | high sensitivity/fast classification | high alignment accuracy | low false positives | computationally efficient |
| Limitations | k-mer ambiguity | computational demands | relies on marker genes | not provide per-read classification |
| Output type | read-level taxonomic assignment | read-level alignments | taxonomic profile (not per-read classification) | genome-level coverage |
| DB:OMM12 | DB:DECOY |
|---|---|
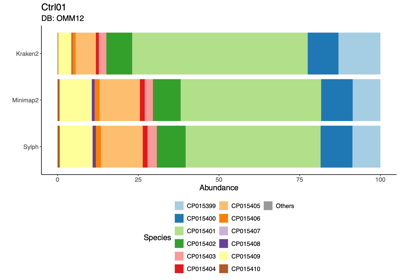 | 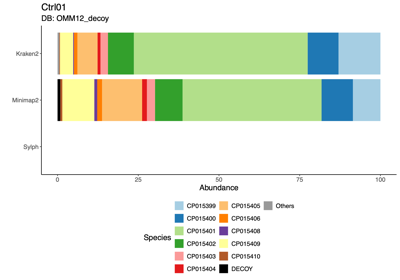 |
| Donor | # Reads | # Contigs | # Consensus | # Bins | # Passed Bins | |
|---|---|---|---|---|---|---|
| F0 | 4,963,485 | 13,899 | 13,899 | 148 | 30 | |
| F1 | 3,581,456 | 7,570 | 7,570 | 116 | 29 | |
| F2 | 4,325,290 | 11,723 | 11,723 | 143 | 35 | |
| F3 | 7,151,869 | 18,791 | 18,791 | 198 | 57 | |
| M4 | 8,050,964 | 11,034 | 11,034 | 125 | 38 | |
| M5 | 6,104,905 | 9,296 | 9,296 | 107 | 32 | |
| F6 | 4,970,540 | 11,399 | 11,399 | 170 | 26 | |
| F7 | 3,914,021 | 11,601 | 11,601 | 171 | 42 | |
| F8 | 2,626,645 | 11,584 | 11,584 | 151 | 39 | |
| F9 | 3,497,575 | 14,524 | 14,521 | 196 | 60 | |
| Total (distinct) | 388 | (165) | ||||
|
BS: the total number of species-assigned k-mers for species S GS: total number of bases in the reference genomes of species S CS: approximates the average genome coverage of species S RAS: CS / Σ Ci, where i indexes each species |
||||||||||||||||||||||||||||||||||||||||||||
| Donors | Mice | |
|---|---|---|
 |
 |
|
 |
 |
|
| Donors | Mice |
|---|---|
 |
 |
 |
 |
B. Microbiome (Figs 1–2)
Donor-stratified bacterial community structure: per-donor relative abundance heatmaps, prominent-taxa engraftment over time, donor-specific stable weeks, tic-tac-toe engraftment classification, α- and β-diversity across compartments, and the operational definition of convergence.- Calculate relative abundance
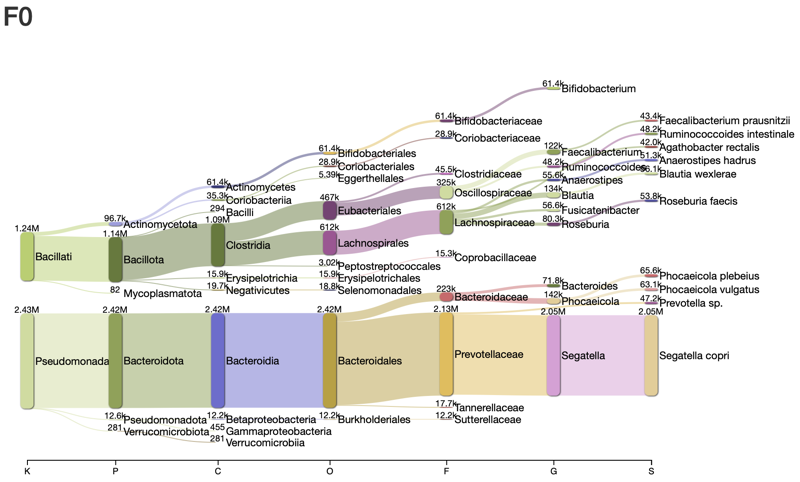
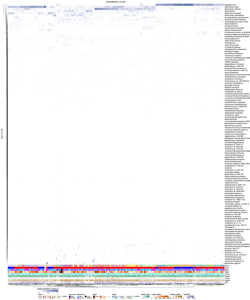
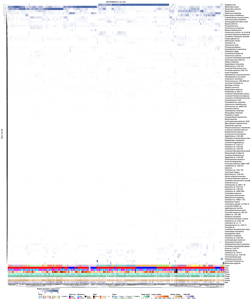
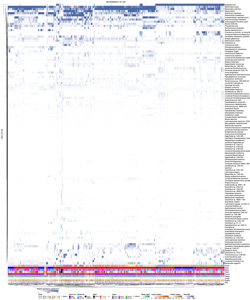
- All samples in a single heatmap
- Each sample in a single heatmap
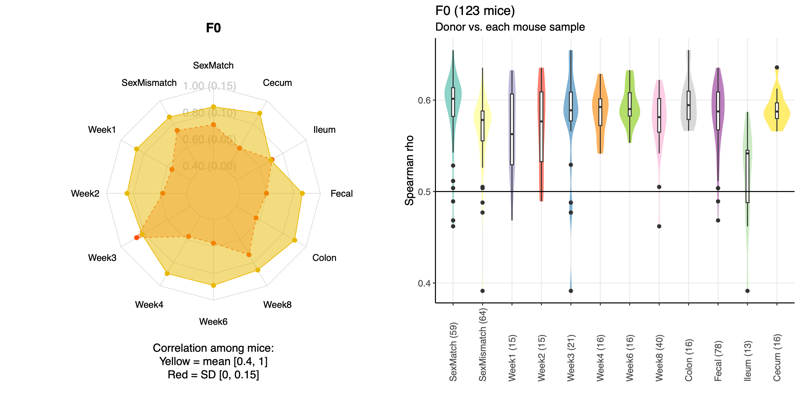
- Correlation/Variability visualization
- Left: For each factor, all pairwise Spearman correlations were calculated among donor-specific recipient mouse groups, excluding the donor sample. In the radar chart, the yellow and red dots indicate the mean and standard deviation of the correlation coefficients, respectively. The mean ranges from 0.4 to 1.0, while the standard deviation ranges from 0 to 0.15, as indicated in parentheses. For example, cecum samples show higher correlations and greater consistency than ileum samples, as reflected by the lower standard deviation in cecum.
- Right: Violin plots show Spearman correlations between the donor and individual mice based on taxonomic relative abundance. The X-axis indicates the factor, the Y-axis shows the correlation coefficient, and each dot represents the correlation between the donor and a single mouse. Numbers in parentheses denote the number of mice in each factor group.
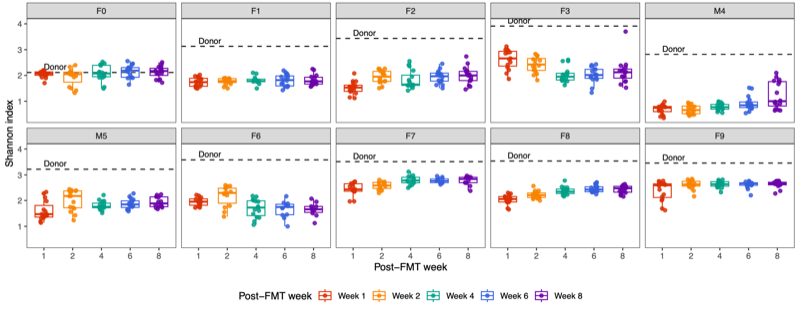
- Diversity
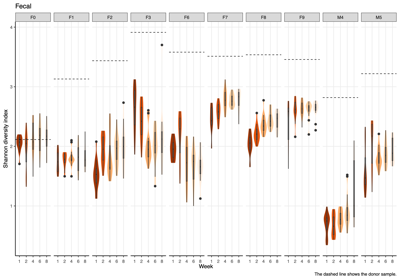
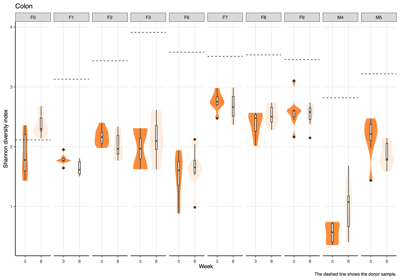
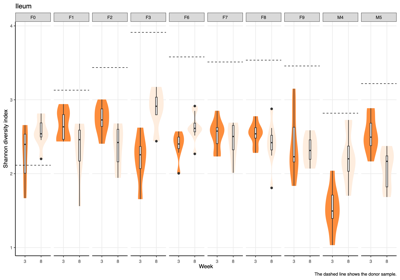
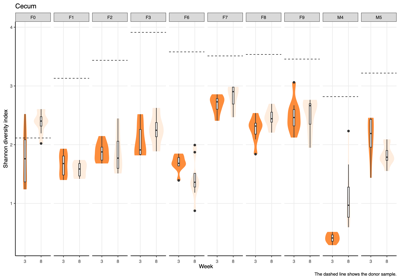
- Alpha diversity (within-sample diversity): The Shannon diversity index was calculated for each donor group, sample type, and week group to compare diversity across weeks.
- Per sample visualization
- Across donors and compartments (fecal, colon, cecum, ileum), alpha diversity did not show a consistent time trend: some donor–tissue groups increased at later weeks, while others decreased or remained unchanged, yielding an overall mixed, donor-specific pattern rather than a uniform week effect.
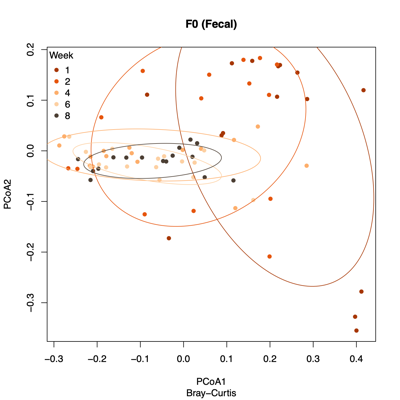
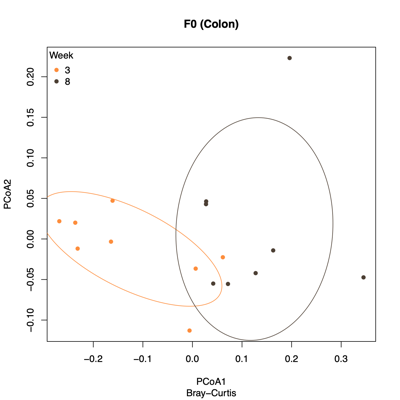
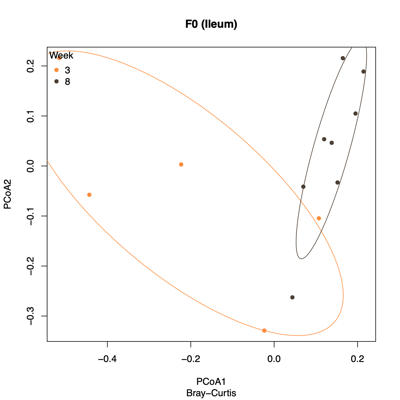
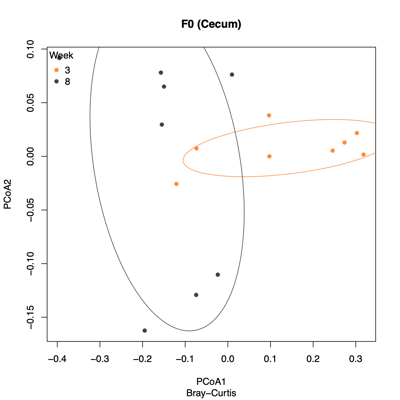
- Bray–Curtis dissimilarity: Between-sample community dissimilarity based on abundance overlap.
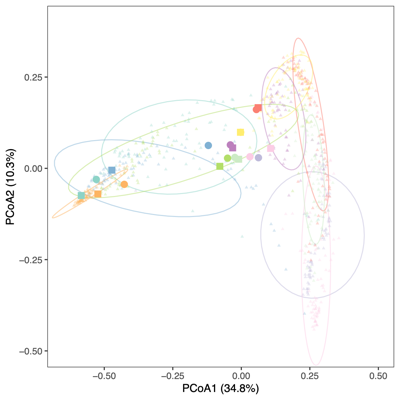
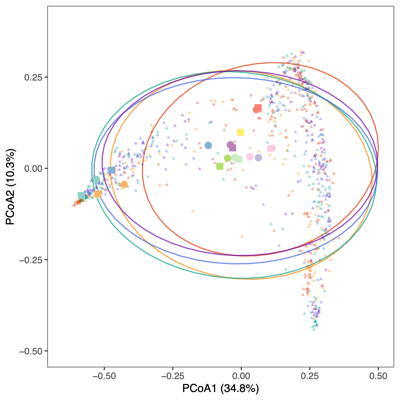
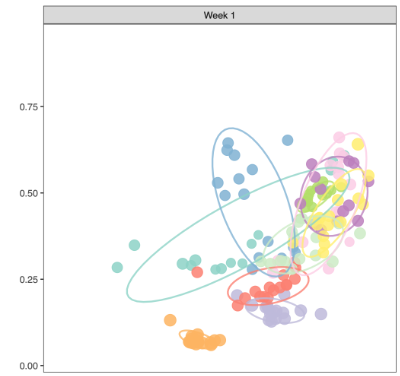
- PCoA (Principal Coordinate Analysis):
Each point = one sample
Distances = compositional dissimilarity
Points closer together = more similar communities
Points farther apart = more different communities - Aitchison distance: Between-sample compositional difference based on log-ratios among taxa (CLR [Centered log ratio] + Euclidean)
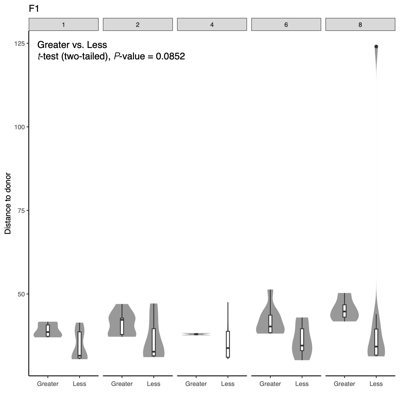
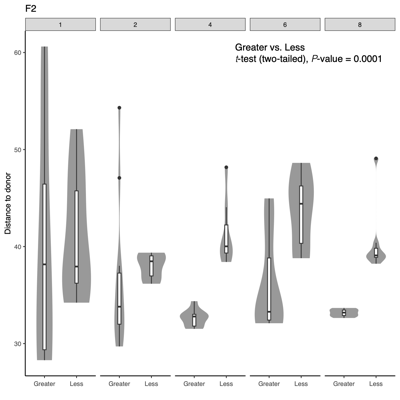
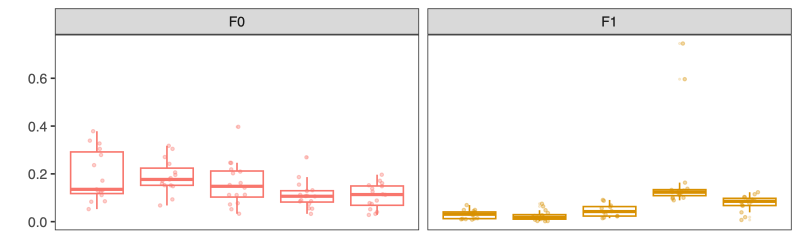
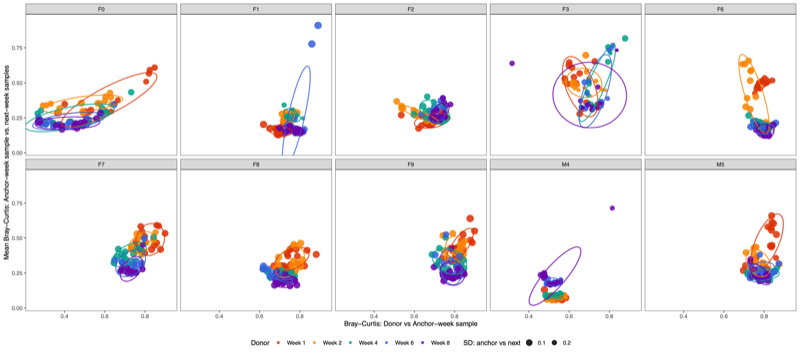
- Distance-to-donor distributions by week:
Smaller = more donor-like
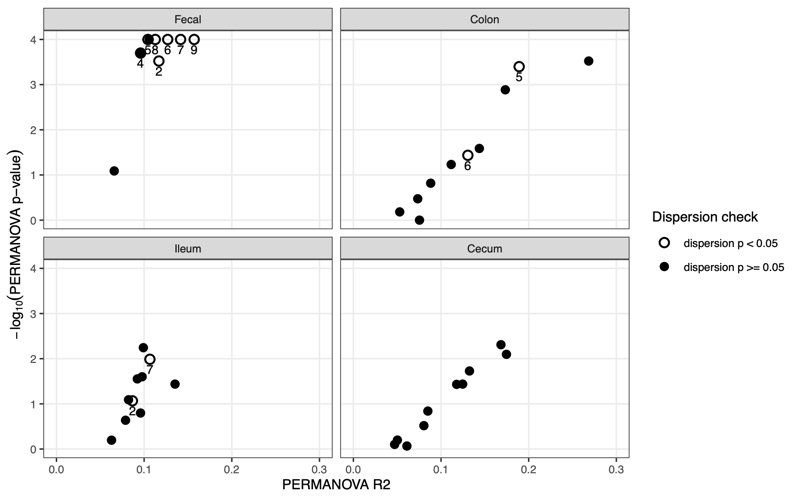
Larger = more shifted from donor - PERMANONA and dispersion:Global and pairwise test results
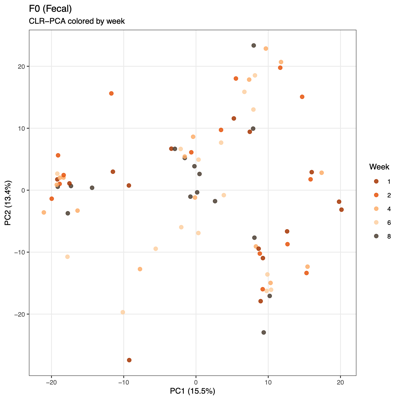
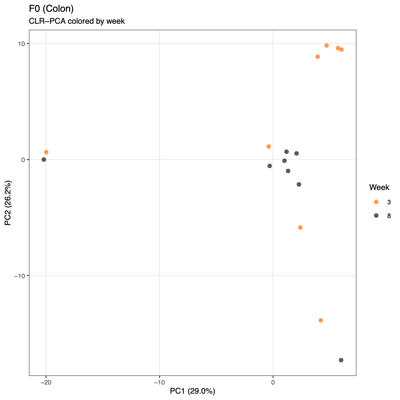
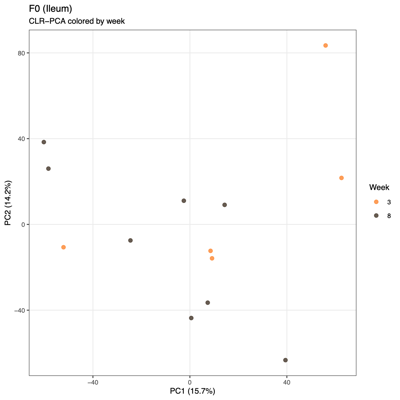
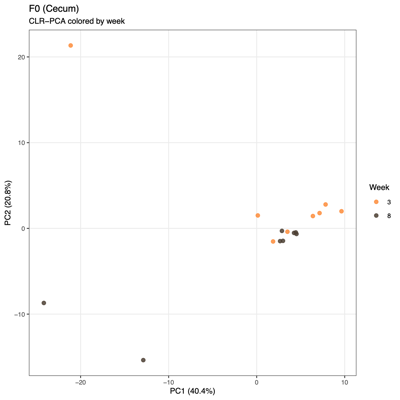
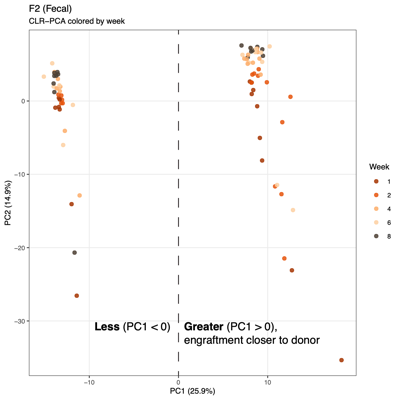
- PCA (Principal Component Analysis)
- Summary of overall compositional variation across samples: PC1 and PC2 capture the largest sources of variation
- Input: CLR (Centered log ratio)-transformed relative abundances: PCA reflects log-ratio balance changes rather than raw proportions
- Note: PCA visualizes variation based on the raw feature space (e.g., transformed taxa abundances), whereas PCoA visualizes differences between samples based on a chosen distance metric (e.g., Bray–Curtis), so PCA reflects variance structure in the data itself, while PCoA reflects ecological dissimilarity between communities.
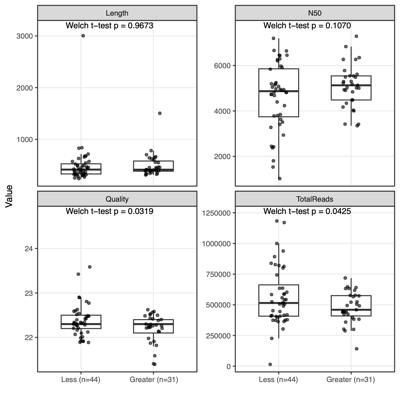
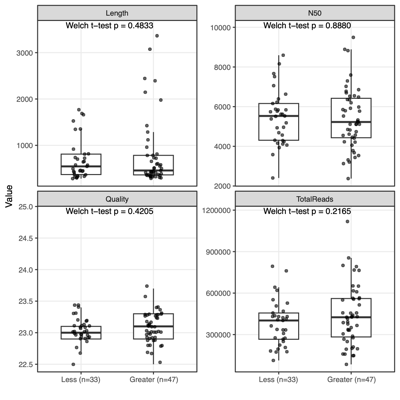
- Unexpected patterns from PCA
- Separation along PC1/PC2 suggests a dominant axis of community change; follow-up analyses were performed to determine whether this pattern reflects technical variation or underlying biological factors.
- F1 finding: The separation is significantly associated with sequencing depth and read quality, suggesting a technical contribution to the observed clustering.
- F2 finding: No measured technical or metadata factors explain the split, indicating a likely biological or taxon-driven signal and motivating taxon-level follow-up.
- Engraftment varies over time
- Enumerate a set of particularly prominent taxa
- The mean relative abundance of each taxon was calculated weekly (e.g., weeks 1, 2, 4, 6, and 8) using fecal samples only, with the donor sample designated as week 0.
- Using a global cohort-level threshold, taxa with engraftment exceeding 5% of the mean relative abundance were selected.
- Thirty-one taxa met this criterion in at least one week or donor group and were therefore defined as prominent taxa.
- Find the most stable engraftment week
- We calculated Spearman correlation coefficients between donor baseline (week 0) and each post-engraftment week.
- Then, we selected the week with the highest correlation (most stable engraftment) using the prominent taxa.
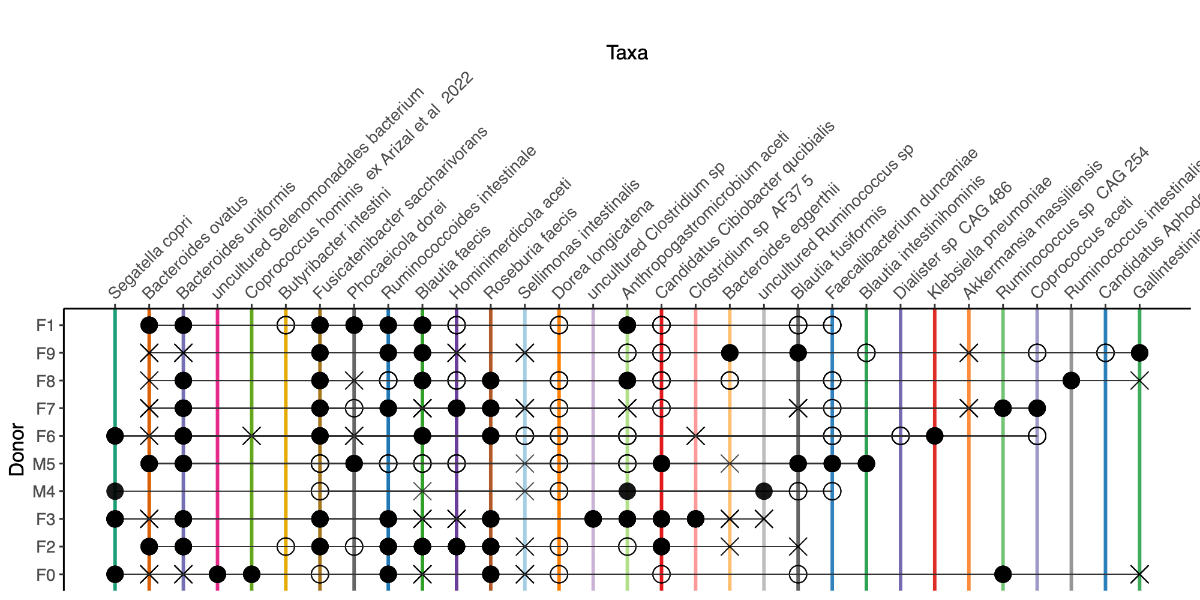
- Taxa and engraftment characteristics
- Using the donor-specific stable weeks defined below, we compared relative abundances between each donor and the corresponding stable-week recipient profile.
- Week 1: F1
- Week 2: F2, F3, M4
- Week 4: F6, F8
- Week 6: F0, M5, F7, F9
- Week 8: None
- A donor-level threshold of 1% was applied to define engraftment status. Taxa with relative abundance >1% were considered present.
- We annotated taxa as follows:
- ⬤ (closed circle) when both donor and recipient were >1%
- ◯ (open circle) when the taxon was >1% in the donor only
- ✕ (cross) when the taxon was >1% in the recipient only
- Alpha and beta diversity
- The Shannon diversity index was calculated for each individual sample, encompassing both donor and mouse specimens. The results were subsequently stratified by donor and presented on a weekly basis to illustrate temporal dynamics in alpha diversity across the study period.
- Bray–Curtis dissimilarity was calculated across all samples within the cohort to assess beta diversity.
- The two figures below illustrate distinct clustering patterns based on different grouping variables.
- Convergence
- As the analytical lead, it is necessary to establish a clear and operational definition of convergence based on the dissimilarity matrix.
- Three complementary metrics should be considered:
- Dispersion: Within-week dissimilarity, typically quantified as the distance of each sample to the group centroid.
- Convergence: Between-week dissimilarity, assessing whether samples from consecutive weeks become progressively more similar (i.e., tighter clustering over time).
- Engraftment: Dissimilarity between mouse samples and their corresponding donor samples, reflecting the degree of donor microbiota establishment.
- A single metric is insufficient to adequately define convergence or stability, as each captures distinct structural aspects of the microbial community.
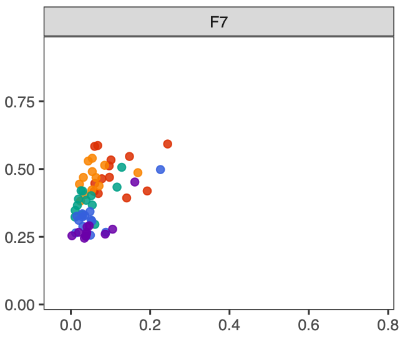
- Convergence can be operationally defined using two primary metrics:
- Dispersion (X-axis): Distance to centroid, representing within-group variability.
- Convergence (Y-axis): Dissimilarity between an anchor week and subsequent week samples, representing temporal tightening or alignment.
- A two-dimensional plot below incorporating engraftment (distance to donor) on the X-axis and cohesion on the Y-axis can provide informative comparisons across donors.
- However, engraftment represents a distinct biological construct—specifically, the degree of similarity to the donor microbiota—rather than the internal stabilization dynamics of the microbial community. Because engraftment reflects donor alignment rather than structural convergence within the cohort, it conveys a different conceptual meaning.
- Therefore, in this study, convergence is defined solely on the basis of "Within-week dispersion" and "Between-week convergence", which together capture intra-group variability and temporal tightening of community structure.
| Capped at 1.0 | Capped at 0.5 | Capped at 0.1 |
|---|---|---|
 |
 |
 |
| Capped | F0 | F1 | F2 | F3 | M4 | M5 | F6 | F7 | F8 | F9 | |
|---|---|---|---|---|---|---|---|---|---|---|---|
| 1.0 | |||||||||||
| 0.5 | |||||||||||
| 0.1 | |||||||||||
| Fecal | Colon |
|---|---|
 |
 |
| Ileum | Cecum |
 |
 |
| Fecal | Colon |
|---|---|
 |
 |
| Ileum | Cecum |
 |
 |
| Type | Distance-to-donor across donors |
|---|---|
| Fecal | 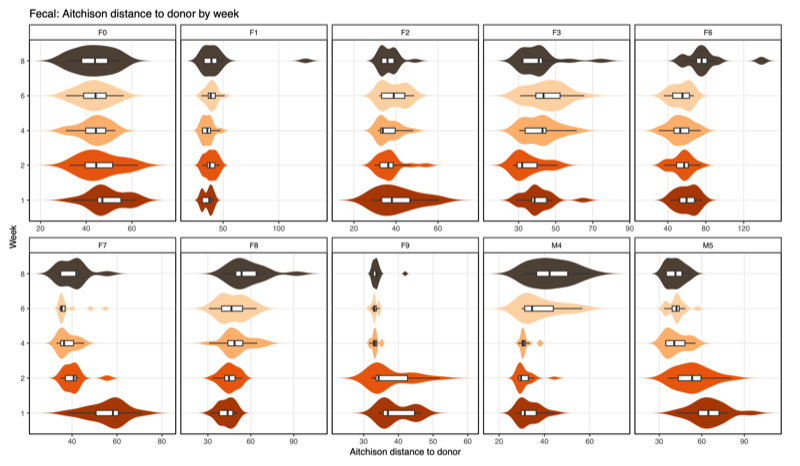 |
| Colon | 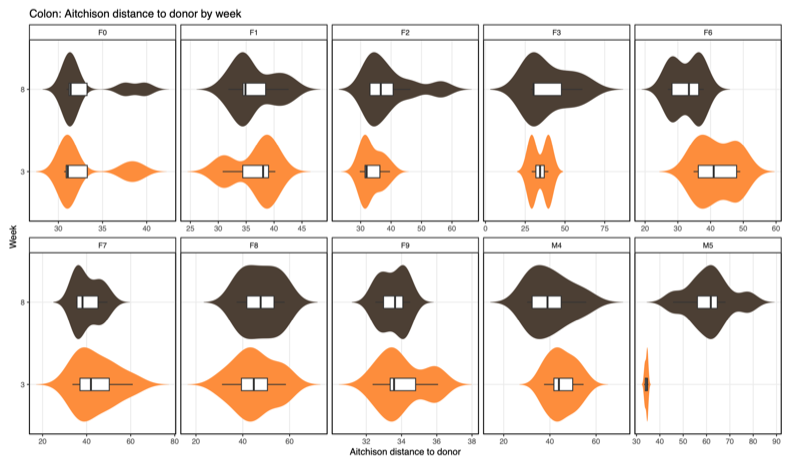 |
| Ileum | 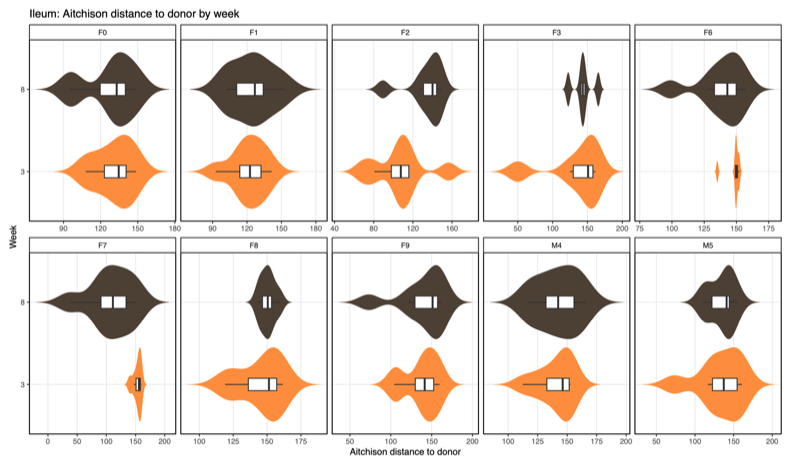 |
| Cecum | 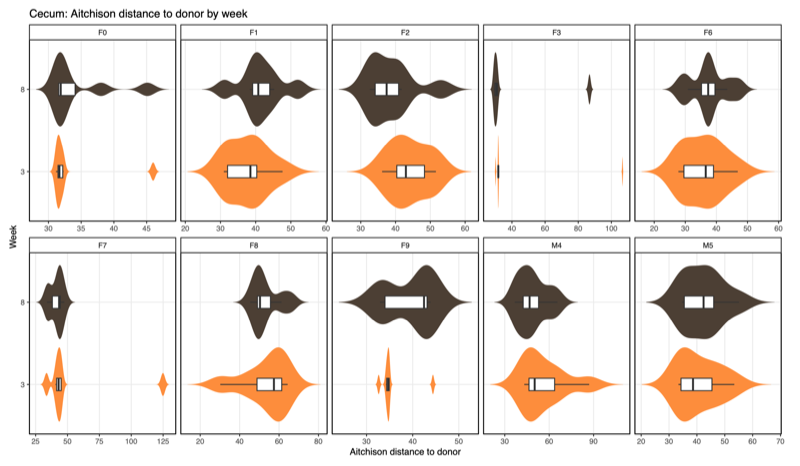 |
| Fecal | Colon |
|---|---|
 |
 |
| Ileum | Cecum |
 |
 |
| F1, fecal | F2, fecal | |
|---|---|---|
| PCA | 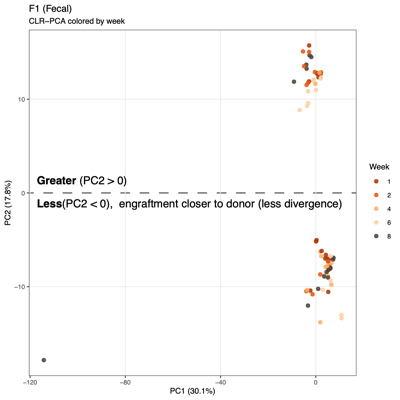 |
 |
| Aitchison distance |
 |
 |
| Technical factors |
 |
 |
| Design (Plate) effect |
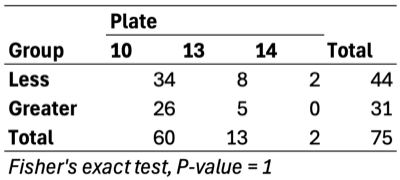 |
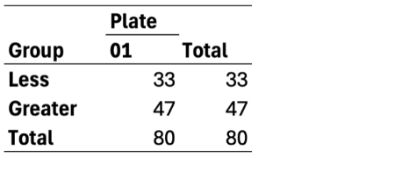 |
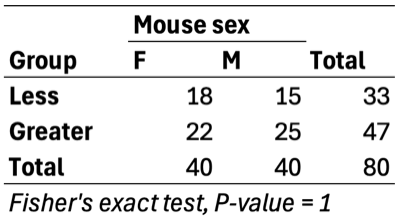
| Mouse sex | 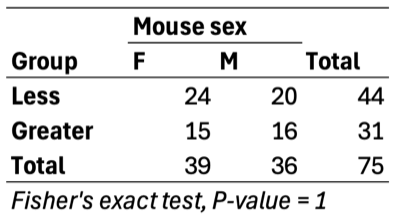 |
 |
| All 123 taxa | 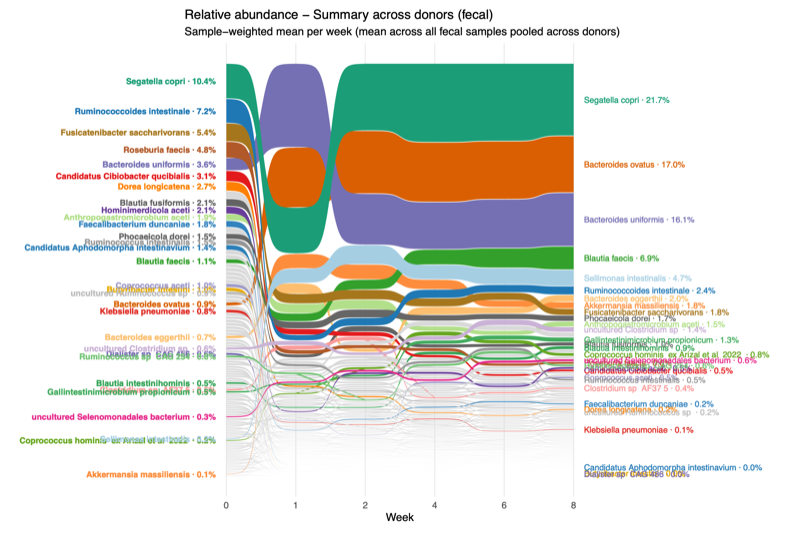 |
| Prominent 31 taxa | 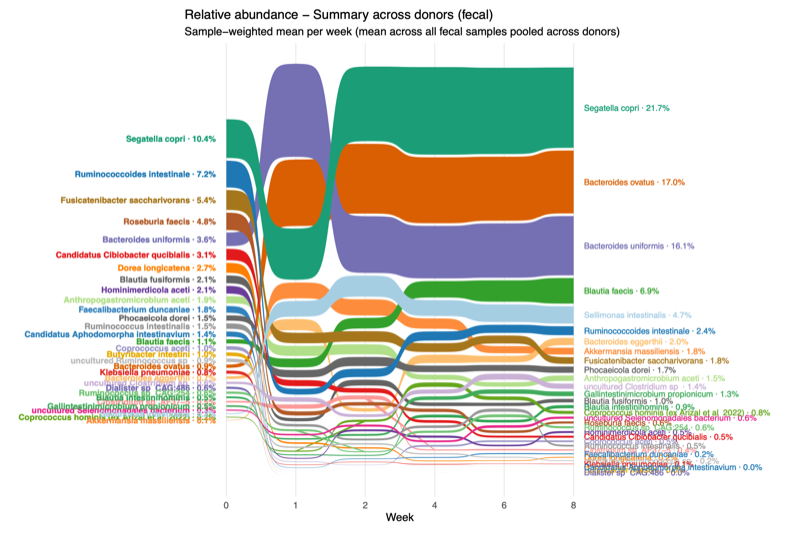 |
| All 123 taxa | 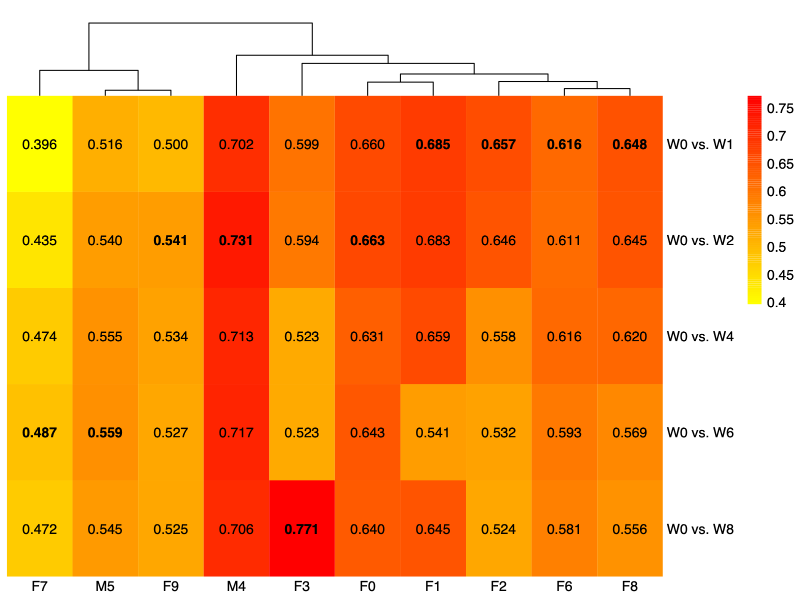 |
| Prominent 31 taxa | 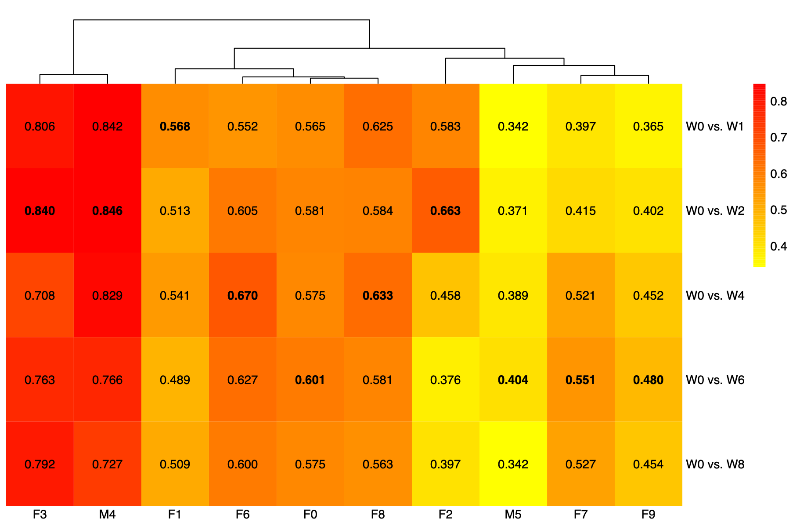 |
| Group by donor | Group by week |
|---|---|
 |
 |
| Group by donor | Group by week |
|---|---|
 |
 |
Discussion
- Donor-dominated variation. Donor identity is the dominant axis of variation in the recipient gut microbiome and its functional potential.
- Engraftment long tail. 42 of 165 donor MAGs absent from recipients; 92 of 123 engrafted MAGs stayed below the 5% prominence threshold throughout follow-up.
- Pipeline contribution. Donor-tailored Kraken2 reference + basen genome-size-aware abundance estimation resolves the low-abundance long tail and is portable to any project-specific reference setting.
- Microbiome structure. Donor-partitioned fecal communities; alpha-diversity ranks preserved across Colon/Ileum/Cecum; functional Spearman > 0.96 to donor stool at each donor’s modal stable week; Ileum least represented by fecal sampling; bacterial × viral structure > bacterial × fungal at this depth.
Limitations
- Only one donor technical replicate at comparable depth/quality — limits variance partitioning.
- Fecal microbiome series anchored to Weeks 1, 2, 4, 6, 8; no fecal sampling at Week 3 (terminal Colon/Ileum/Cecum collected at Week 3 instead).
- Minimal filtering preserves exploratory variability; downstream inferential reuse requires question-specific thresholds.
- Mycobiome (0.02%) and virome (0.17%) reads are minor at this sequencing depth — cross-kingdom power is correspondingly limited.
- Feature universe is donor-bounded: taxa below assembly detection in donor stool are not in the recipient classification space.
Data Availability
- [SRA (Sequence Read Archive)] pending
- [Shiny app] MICROBENCH
Code Availability
- [Zenodo] Scripts
- [GitHub] Griffin-Pipeline
- [GitHub] basen (Base-level Abundance estimation with Species-assigned Evidence using Nanopore)
References
-
Aroney et al. CoverM: read alignment statistics for metagenomics. Bioinformatics 2025;41(4):btaf147.
Blanco-Míguez et al. Extending and improving metagenomic taxonomic profiling with uncharacterized species using MetaPhlAn 4. Nat Biotechnol 2023;41(11):1633-1644.
Chaumeil et al. GTDB-Tk v2: memory friendly classification with the genome taxonomy database. Bioinformatics 2022;38(23):5315-5316.
Danecek et al. Twelve years of SAMtools and BCFtools. Gigascience 2021;10(2):giab008.
De Coster and Rademakers. NanoPack2: population-scale evaluation of long-read sequencing data. Bioinformatics 2023;39(5):btad311.
Ewels et al. MultiQC: summarize analysis results for multiple tools and samples in a single report. Bioinformatics 2016;32(19):3047-8.
Kolmogorov et al. metaFlye: scalable long-read metagenome assembly using repeat graphs. Nat Methods 2020;17(11):1103-1110.
Li. Minimap2: pairwise alignment for nucleotide sequences. Bioinformatics 2018;34(18):3094-3100.
Pan et al. A deep siamese neural network improves metagenome-assembled genomes in microbiome datasets across different environments. Nat Commun 2022;13(1):2326.
Phipson and Smyth. Permutation P-values should never be zero: calculating exact P-values when permutations are randomly drawn. Stat Appl Genet Mol Biol 2010;9(1):Article 39.
Seo et al. Dual platform spatial transcriptomics reveals parvalbumin interneuron subtype vulnerability in mouse models of Alzheimer’s disease. Nat Commun 2026.
Shaw and Yu. Rapid species-level metagenome profiling and containment estimation with sylph. Nat Biotechnol 2025;43(8):1348-1359.
Walter et al. Establishing or exaggerating causality for the gut microbiome: Lessons from human microbiota-associated rodents. Cell 2020;180(2):221-232.
Wood et al. Improved metagenomic analysis with Kraken 2. Genome Biol 2019;20(1):257.
Abbreviations
Click to expand
-
ANI, average nucleotide identity (sketch-based k-mer sampling)
BH, Benjamini–Hochberg (false discovery rate correction)
bp, base pair
CLR, centered log-ratio
ctrl, control
CyTOF, time-of-flight mass cytometry
D, donor(s)
DB, database
FDR, false discovery rate
FMT, fecal microbiota transplant
HMA, human microbiota-associated
LC–MS, liquid chromatography–mass spectrometry
MAG, metagenome-assembled genome
neg, negative
OMM (OMM12), oligo mouse microbiota
ONT, Oxford Nanopore Technologies
PCA, principal component analysis
PCoA, principal coordinates analysis
PERMANOVA, permutational multivariate analysis of variance
QC, quality control
SD, standard deviation